Skip to content
recaplica

    One moment: security check

    Cloudflare wants to make sure you're not a robot. Tick the box below and your search will continue on its own.

    IT
    recaplica Poorest Countries in the World: The Ranking and How It's Measured
    © 2026 Recaplica · recaplica.com — All rights reserved
    Home › Economics

    Poorest Countries in the World: The Ranking and How It's Measured

    By Recaplica Newsroom · Updated on October 1, 2026

    What to print

    Page numbers appear when printing with default margins.

    Slides

    Choose a cut

    Flash10 slidesThe essential thread, to present in classFull15 slidesEvery chapter and the deeper detail

    Both come with speaker notes.

    Telegram channel
    recaplica Clear in 30 seconds, yours in 10 minutes.
    In 30 seconds Key points Figures Deep dive Slides Myths Mind map Quiz Flashcards FAQ

    In 30 seconds quick read

    Every year the World Bank sorts the world's countries by income, and the bottom of that list has been almost entirely Sub-Saharan African for years. GDP per capita and the UN's Human Development Index are the two main tools used to measure that gap: in 2026 Yemen has the lowest GDP per capita in the world according to the IMF, while South Sudan has the lowest Human Development Index according to the latest available UNDP report. In Europe, Moldova is often called the poorest country on the continent, but that's a relative comparison: the World Bank doesn't even place it in the low-income band where the African countries in the ranking fall.

    Key Points

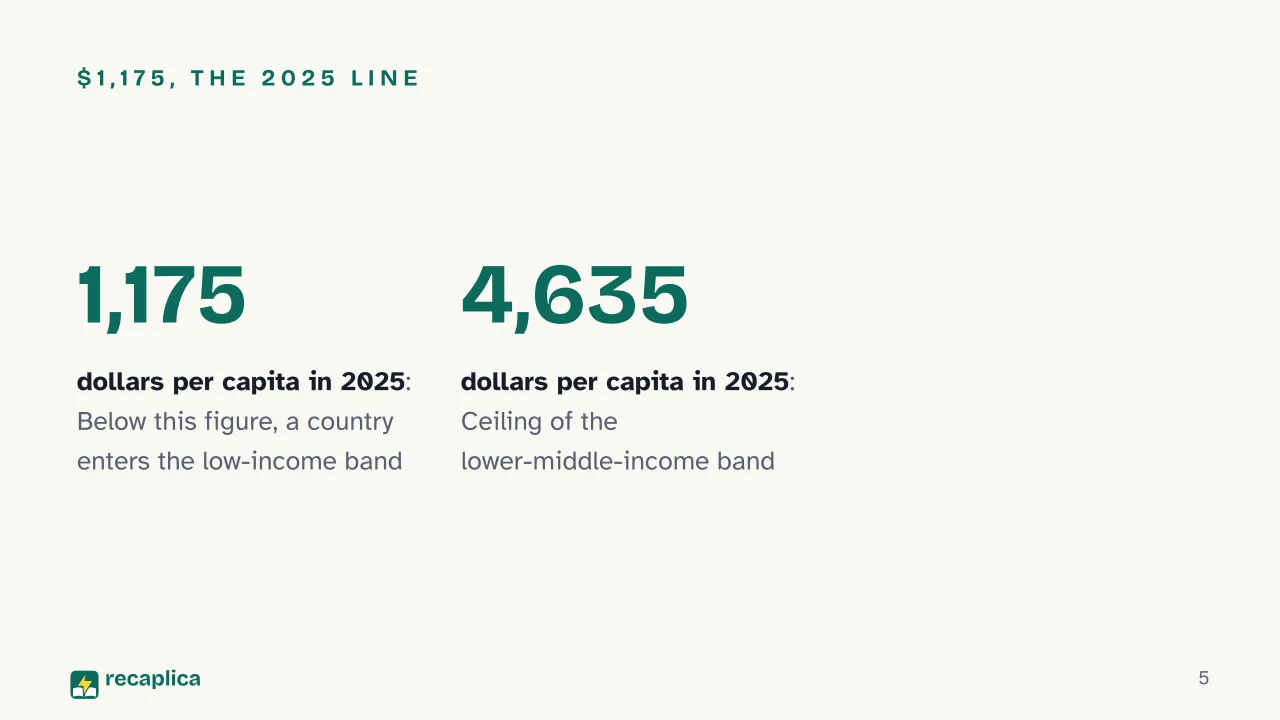
    • The World Bank classifies as 'low income' any country with a gross national income per capita of $1,175 or less in 2025.
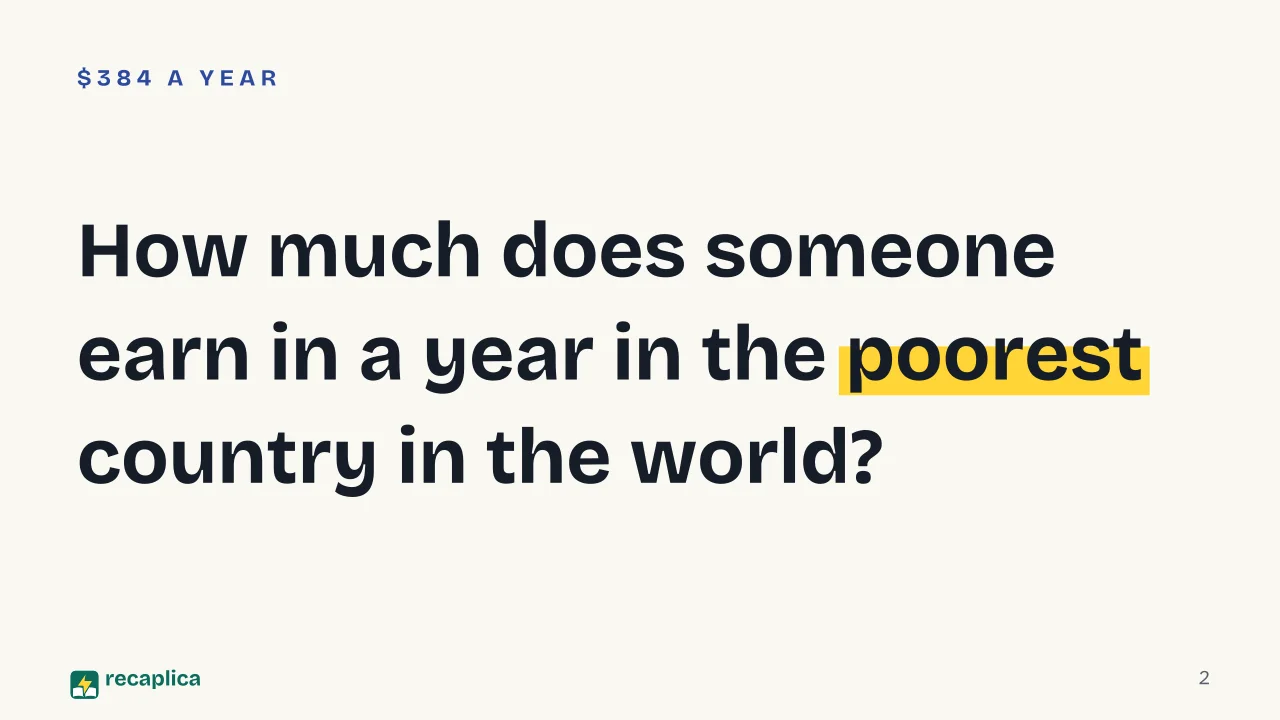
    • In the IMF's 2026 estimates, Yemen sits at the bottom of the world ranking, at around $384 in GDP per capita.
    • South Sudan has the lowest Human Development Index (HDI) in the world, 0.388 in 2023, according to the UNDP.
    • Sub-Saharan Africa held 70% of the world's extreme poor in 2024, according to the World Bank.
    • Moldova is considered the poorest country in Europe by relative comparison with the continent; the World Bank still places it in the upper-middle-income band.
    • The HDI combines health, education and living standards into a single index: a wider view than income alone.

    Key figures

    • $384 The average yearly income per person in Yemen in 2026 according to the IMF: the lowest in the world ranking. Source: IMF, World Economic Outlook Database
    • 0.388 South Sudan's Human Development Index in 2023, the lowest among the 193 countries ranked by the UNDP. Source: UNDP, Human Development Report 2025
    • 70% Share of the world's extreme poor who lived in Sub-Saharan Africa in 2024, according to the World Bank. Source: World Bank

    Deep Dive

    Judging how poor a country is takes more than a glance at its income: it takes indicators, and each one tells its own part of the story. The World Bank ranks nations by income, the UNDP ranks them by human development, and the two rankings look alike without quite matching.

    How Economists Measure Poverty Between Countries

    Under the World Bank’s classification in force from July 2026 to June 2027, a country enters the “low income” band when its gross national income per capita (calculated with the Atlas method) stays at $1,175 or less in 2025. The next band, “lower-middle income,” spans $1,176 to $4,635. The classification is updated every year, and movement between bands is real: in the 2026-2027 update, Togo moved out of the low-income group.

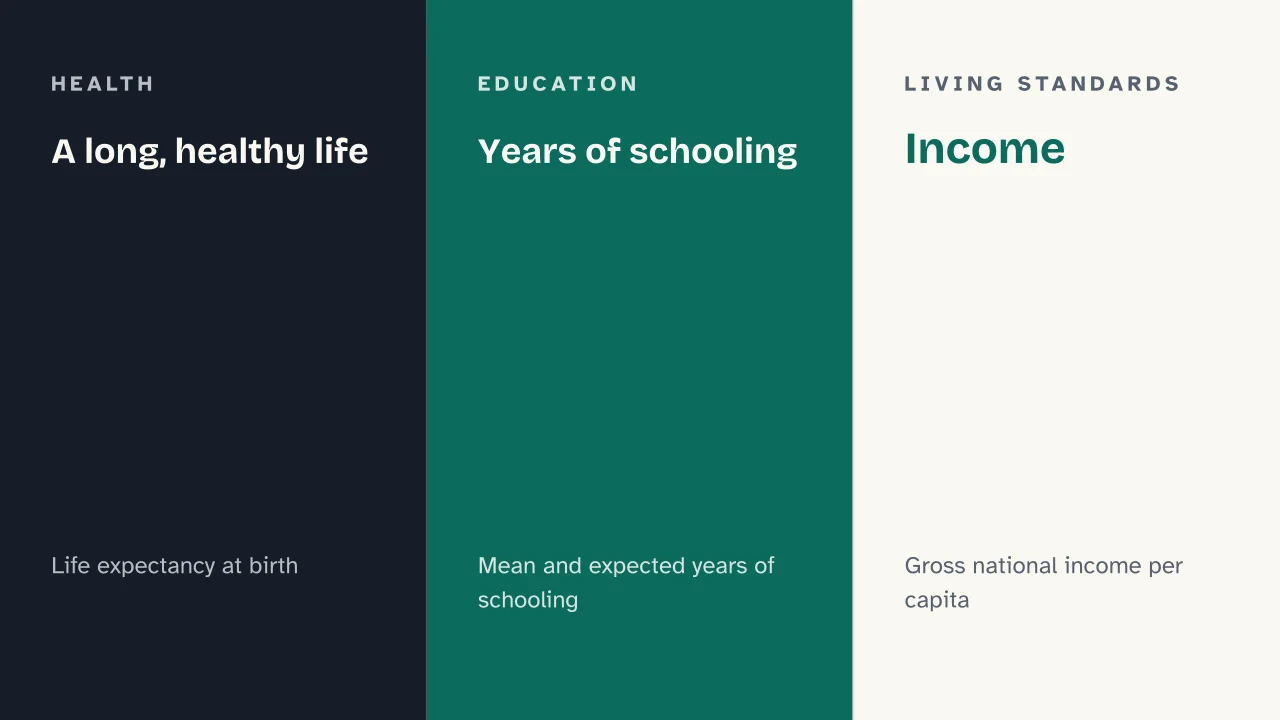
    Income per capita alone isn’t enough, though. The UNDP calculates the Human Development Index (HDI) by combining three dimensions with a geometric mean: health, measured through life expectancy at birth; education, measured through the average years of schooling adults have completed and the years of schooling children are expected to receive; and standard of living, measured through gross national income per capita. A country can have a low GDP and a relatively less low HDI if public spending genuinely reaches health care and schools — or the other way around.

    Practical example: comparing two countries on GDP per capita alone can give a partial picture. If a country has a lower-middle income but invests in public hospitals and schools, its HDI can end up higher than income alone would suggest: that’s why international agencies use both indicators together, not one in place of the other.

    The Ranking by GDP Per Capita

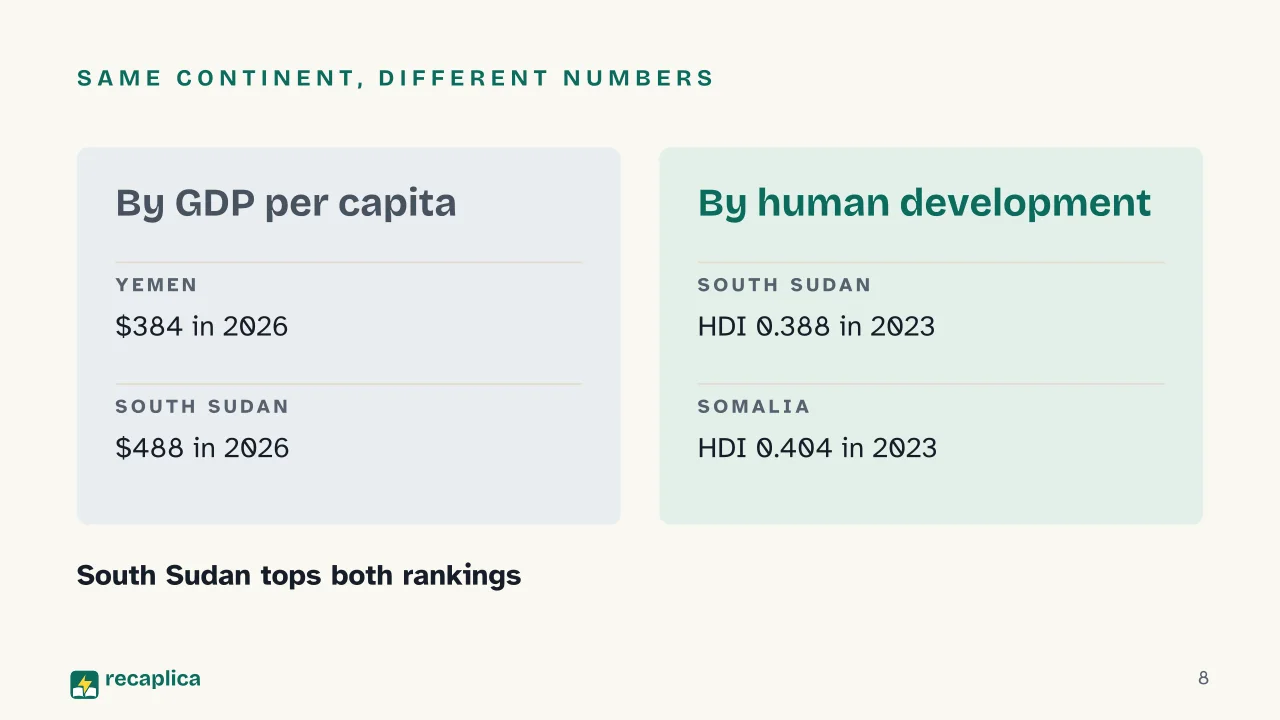
    According to the IMF’s World Economic Outlook database, Yemen has the lowest nominal GDP per capita in the world in 2026, at around $384. South Sudan follows close behind, at around $488, and Burundi at around $546. Afghanistan, with a GDP per capita estimated at $448, fits into this same range, but with a figure from 2025: the IMF hasn’t published a 2026 estimate for it yet.

    CountryIndicatorValueYear
    YemenGDP per capita (IMF)$3842026
    AfghanistanGDP per capita (IMF)$4482025
    South SudanGDP per capita (IMF)$4882026
    BurundiGDP per capita (IMF)$5462026
    Central African RepublicGDP per capita (IMF)$6132026
    MozambiqueGDP per capita (IMF)$6322026
    MadagascarGDP per capita (IMF)$6562026
    SomaliaGDP per capita (IMF)$8132026
    NigerGDP per capita (IMF)$8222026
    South SudanHDI (UNDP)0.3882023
    SomaliaHDI (UNDP)0.4042023
    Central African RepublicHDI (UNDP)0.4142023

    The HDI ranking tells much the same story, though not in the exact same order. According to the statistical annex of the UNDP’s Human Development Report 2025, covering 2023, South Sudan has the lowest HDI in the world, 0.388, last among 193 countries. Somalia follows (0.404), then Central African Republic (0.414), Chad (0.416), Mali and Niger tied (0.419), Burundi (0.439), Burkina Faso (0.459), Sierra Leone (0.467), Yemen (0.470), Madagascar (0.487) and Mozambique (0.493): all but Yemen are Sub-Saharan African countries, and all fall in the “low human development” band.

    Why the Ranking Is Almost Entirely Sub-Saharan Africa

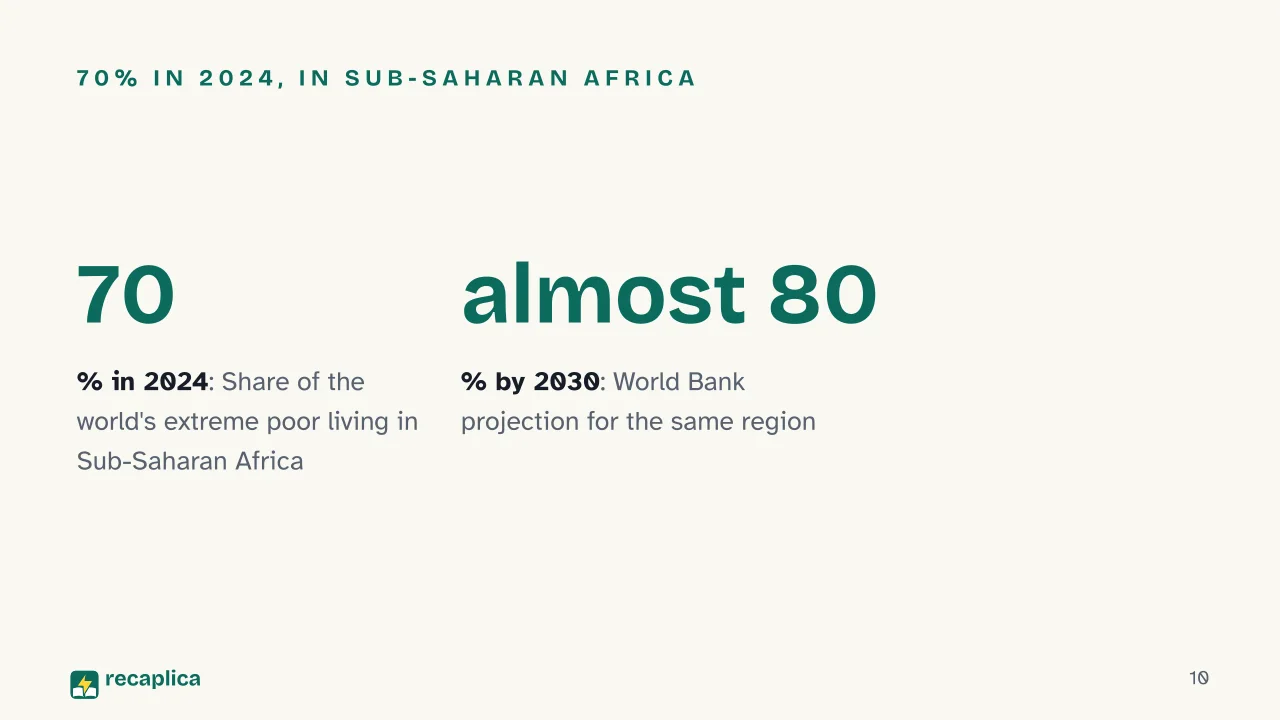
    The concentration isn’t an isolated statistical detail. In 2024, 70% of people living in extreme poverty worldwide were concentrated in Sub-Saharan Africa, the World Bank reports, and projections point to that share climbing to almost 80% by 2030.

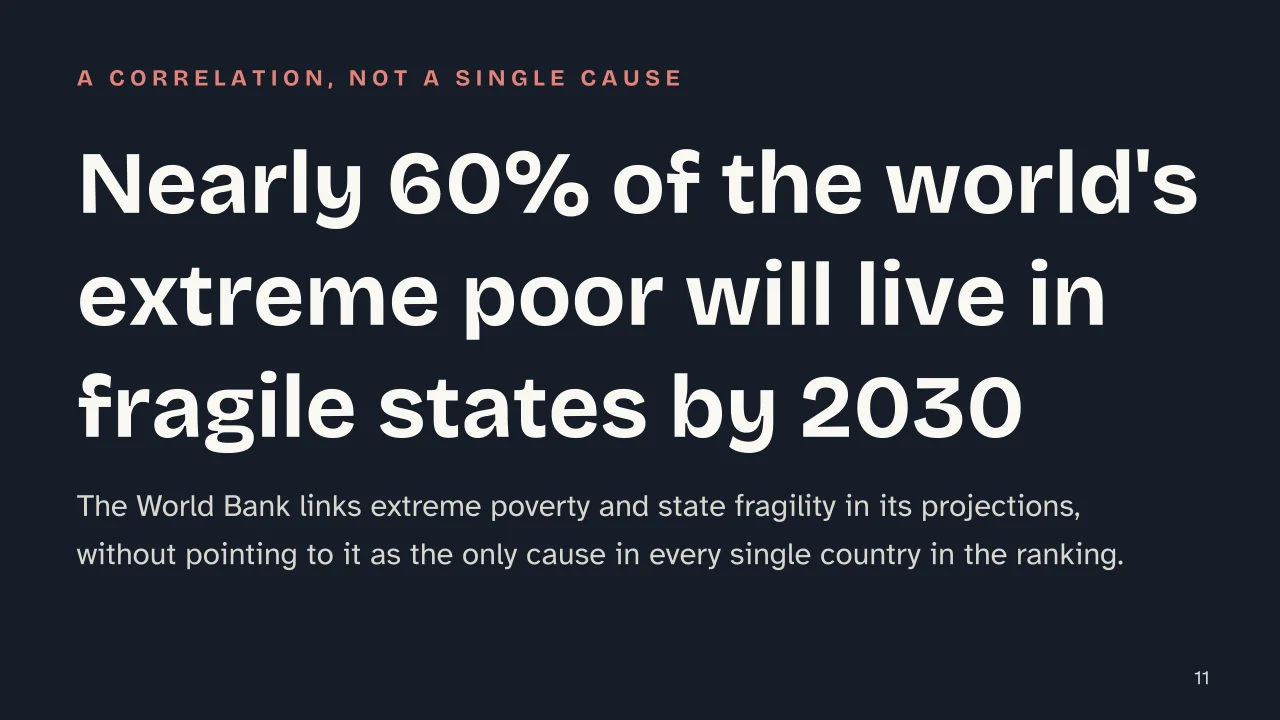
    Among the factors the World Bank links to this trajectory is state fragility — conflict and institutional instability. The World Bank’s projections estimate that by 2030, nearly 60% of the world’s extreme poor, around 436 million out of 757 million, will live in countries classified as fragile; fragile states in Sub-Saharan Africa alone would account for 367 million of them, nearly half the world total. It’s a correlation the World Bank documents with precise figures. It doesn’t explain every single country on the list, though: some of those at the bottom of the GDP or HDI rankings aren’t, as of 2026, in an active conflict. For a wider look at the economic context these countries sit in, and how global trade flows have touched them differently than richer economies, the Recap on globalization: definition, history, and how world trade works is a useful next read; for the opposite end of the scale, the economies with the highest GDP, there’s the ranking of the world’s biggest economies.

    The European Exception: Moldova

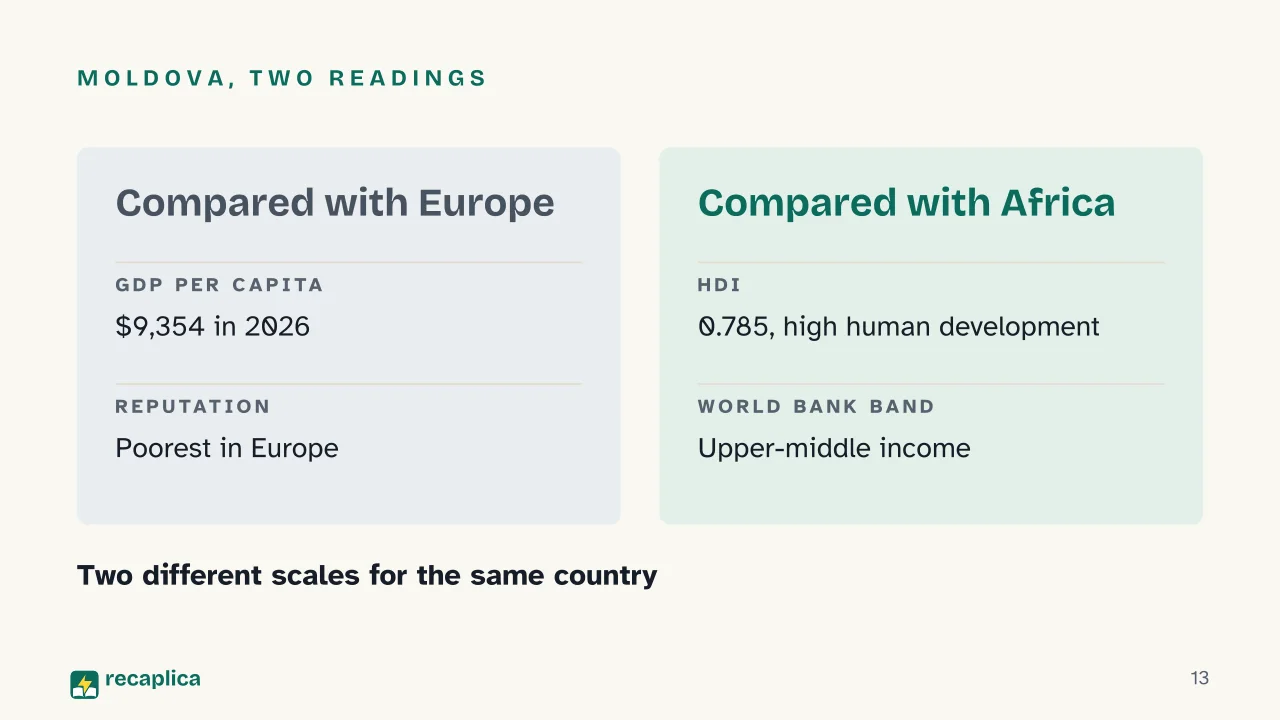
    Moldova is often called the poorest country in Europe. According to the IMF’s World Economic Outlook database, its nominal GDP per capita is estimated at $9,354 for 2026; at purchasing power parity, the estimate rises to $21,170, also according to the IMF.

    Those numbers have little in common with the countries at the bottom of the world ranking. Its HDI, according to the UNDP, is 0.785, in the “high human development” band — more than double South Sudan’s 0.388. The World Bank, consistently, places it in the upper-middle-income band rather than the low-income one. “Poorest in Europe,” then, only holds within that one comparison. Set against the world ranking, Moldova’s income and HDI put it nowhere near the African countries at the bottom of it. For more on what separates poverty, inequality and underdevelopment — useful beyond this comparison too — there’s the Recap defining the three concepts; and the yardstick used here to measure income deserves its own closer look, in the Recap on GDP: what it is and how it’s calculated.

    Slide deck

    Slides ready to download and make your own in PowerPoint or Google Slides, with speaker notes. Pick the Flash cut or the Full one.
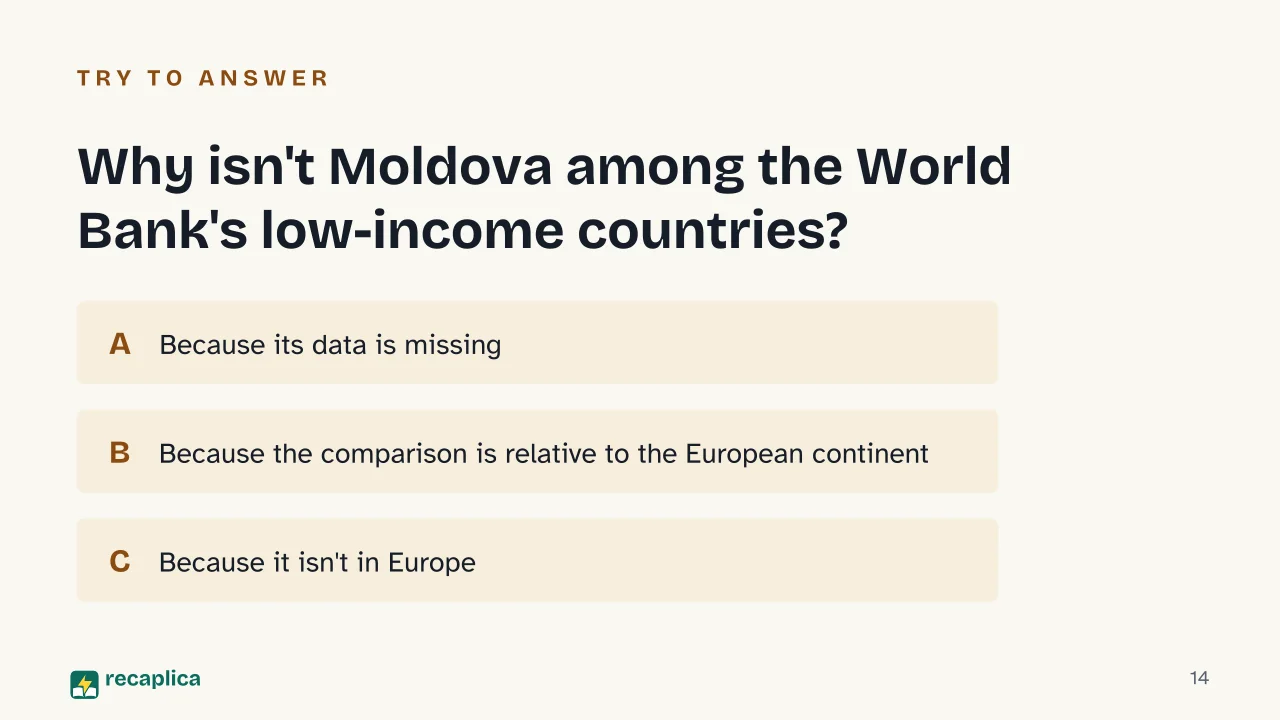
    Slide 1 of the presentation on Poorest Countries in the World: The Poorest Countries in the WorldSlide 2 of the presentation on Poorest Countries in the World: How much does someone earn in a year in the poorest country in the world?Slide 3 of the presentation on Poorest Countries in the World: From income to the world mapSlide 4 of the presentation on Poorest Countries in the World: Chapter 01: Two ways to measure itSlide 5 of the presentation on Poorest Countries in the World: $1,175, the 2025 lineSlide 6 of the presentation on Poorest Countries in the World: A long, healthy life · Years of schooling · IncomeSlide 7 of the presentation on Poorest Countries in the World: Chapter 02: The ranking by GDPSlide 8 of the presentation on Poorest Countries in the World: Same continent, different numbersSlide 9 of the presentation on Poorest Countries in the World: Chapter 03: Why it's almost all AfricaSlide 10 of the presentation on Poorest Countries in the World: 70% in 2024, in Sub-Saharan AfricaSlide 11 of the presentation on Poorest Countries in the World: Nearly 60% of the world's extreme poor will live in fragile states by 2030Slide 12 of the presentation on Poorest Countries in the World: Chapter 04: The European exceptionSlide 13 of the presentation on Poorest Countries in the World: Moldova, two readingsSlide 14 of the presentation on Poorest Countries in the World: Why isn't Moldova among the World Bank's low-income countries?Slide 15 of the presentation on Poorest Countries in the World: Now, the recap
    Flash10 slidesThe essential thread, to present in classFull15 slidesEvery chapter and the deeper detail

    Common myths

    • ✗ Myth The poorest countries in the world are the ones with the most ongoing wars.

      ✓ Reality The World Bank links extreme poverty and state fragility with precise projections (by 2030, nearly 60% of people in extreme poverty would live in fragile states), but some countries at the bottom of the income ranking aren't, as of 2026, in an active conflict — it's a correlation about the region as a whole, more than about every single case.

    • ✗ Myth Moldova is as poor as the countries at the bottom of the world ranking.

      ✓ Reality Moldova has a Human Development Index of 0.785, in the 'high human development' band, far above the 0.388-0.493 range of the lowest-ranked African countries: its 'poorest in Europe' label comes from comparing it with the rest of the continent.

    • ✗ Myth GDP per capita alone is enough to say how poor a country is.

      ✓ Reality The UNDP's Human Development Index adds health and education data to income: two countries with the same GDP per capita can end up with a different HDI, depending on how much of that public spending actually reaches hospitals and schools.

    Mind map

    Drag the background to move around and the nodes to reposition them; use − and + to collapse and expand branches.
    Customize
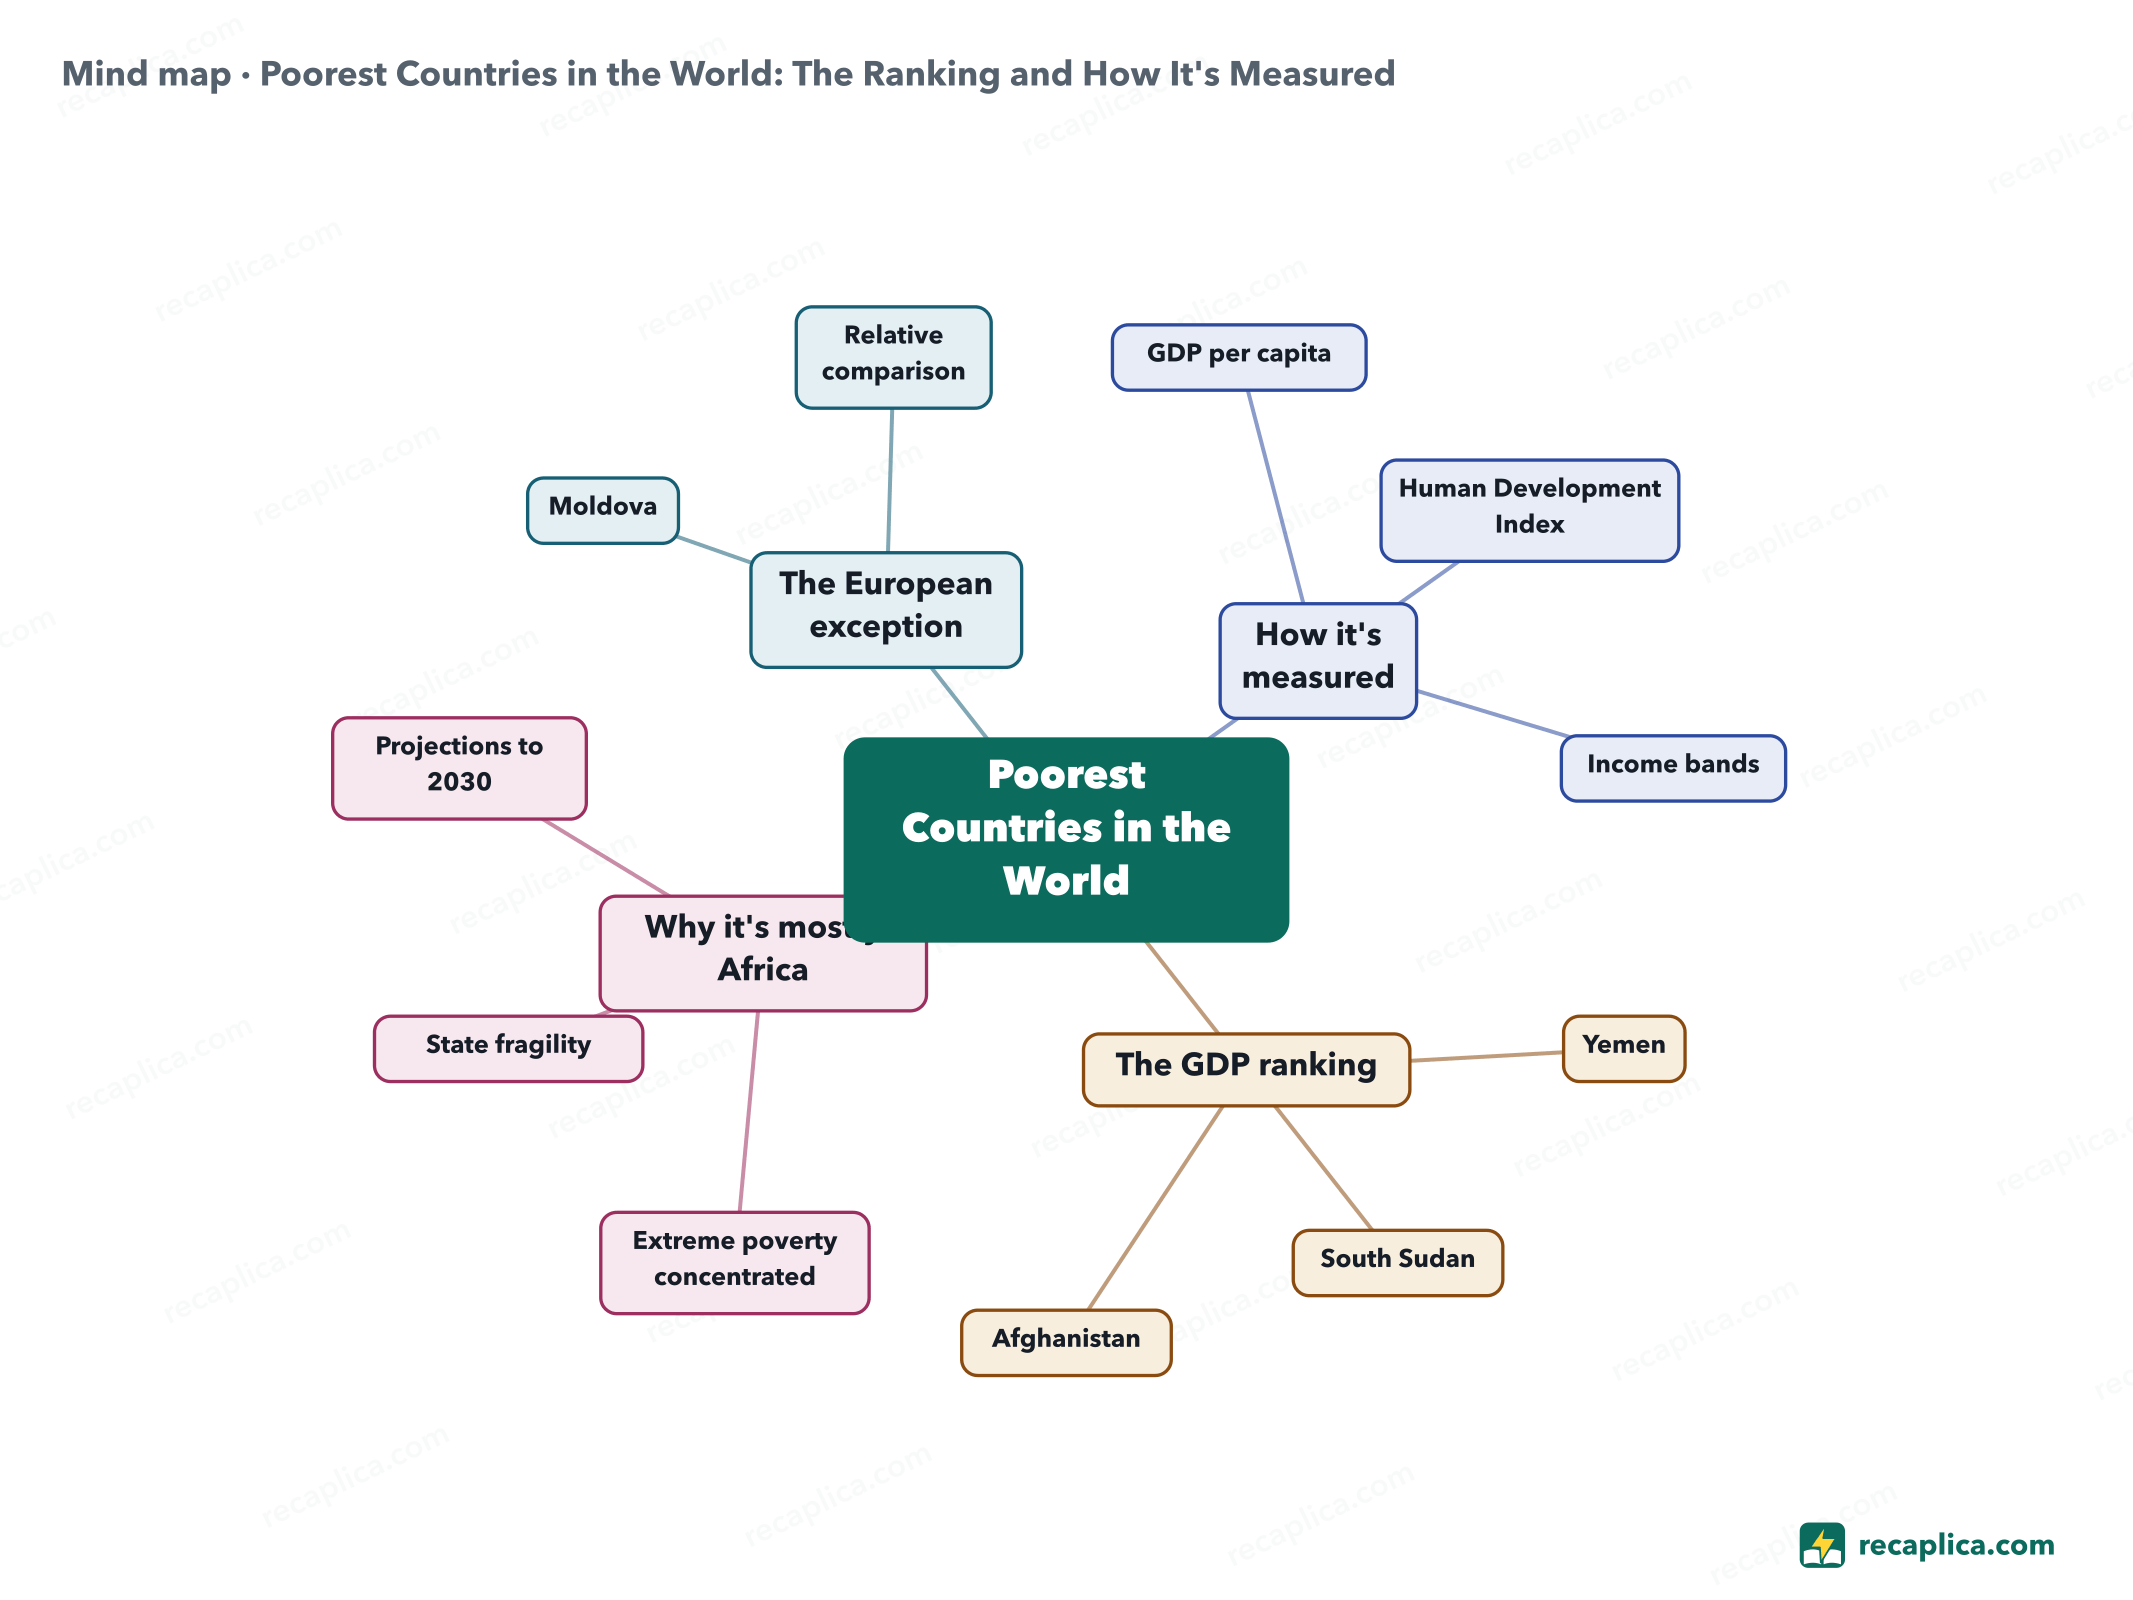
    Mind map: Poorest Countries in the World: The Ranking and How It's Measured
    • Poorest Countries in the World
      • How it's measured
        • GDP per capita Gross national income divided by population, World Bank Atlas method
        • Human Development Index Health, education and living standards combined by the UNDP
        • Income bands Low, lower-middle, upper-middle, high, updated every year
      • The GDP ranking
        • Yemen $384 per capita in 2026, the lowest figure
        • South Sudan $488 per capita in 2026
        • Afghanistan $448 per capita in 2025
      • Why it's mostly Africa
        • Extreme poverty concentrated 70% of the world's extreme poor in 2024
        • State fragility Documented correlation from the World Bank, one factor among others
        • Projections to 2030 Sub-Saharan Africa would reach almost 80% of world extreme poverty
      • The European exception
        • Moldova World Bank band, upper-middle income
        • Relative comparison Poorest in Europe, a comparison within the continent

    Quiz: test yourself

    Answer the questions to check what you have learned: you get instant feedback and a short explanation.

    Grade 0/10 0/5
    1 According to the World Bank, what threshold defines a 'low income' country in 2025?

    The World Bank sets the 'low income' threshold at $1,175 or less in gross national income per capita in 2025, the basis for the classification covering fiscal year 2027.

    2 According to the IMF, which country has the lowest nominal GDP per capita in the world in 2026?

    The IMF's 2026 estimates put Yemen at the bottom for nominal GDP per capita, around $384; Afghanistan's figure is higher but refers to 2025, since the IMF hasn't published a 2026 estimate for it yet.

    3 Besides income, what does the UNDP's Human Development Index (HDI) measure?

    The HDI combines three dimensions: health (measured with life expectancy at birth), education (years of schooling) and standard of living (gross national income per capita).

    4 True or false: according to the World Bank, extreme poverty in Sub-Saharan Africa is caused exclusively by armed conflict.

    The World Bank's projections link state fragility and extreme poverty with precise figures, but that remains a regional-level pattern: treating it as an automatic explanation for every single country in the ranking stretches the data further than it actually goes.

    5 Why doesn't Moldova appear among the World Bank's low-income countries, despite being called the poorest in Europe?

    The 'poorest in Europe' label measures Moldova against other European countries; globally, the World Bank places it in a higher income band than the African countries in the ranking, backed by a GDP per capita and an HDI (0.785) far above theirs.

    Answers: 1-A · 2-B · 3-B · 4-B · 5-B

    Flashcards

    Tap the card to flip it and check whether you remember the answer, then move to the next one.

    1 / 7

    Explain it in your own words

    The ultimate test: if you can explain it in simple words, you've truly understood it. Write your explanation, then compare it with the Recap.

    Your explanation is saved only on this device.

    Every year the World Bank sorts the world's countries by income, and the bottom of that list has been almost entirely Sub-Saharan African for years. GDP per capita and the UN's Human Development Index are the two main tools used to measure that gap: in 2026 Yemen has the lowest GDP per capita in the world according to the IMF, while South Sudan has the lowest Human Development Index according to the latest available UNDP report. In Europe, Moldova is often called the poorest country on the continent, but that's a relative comparison: the World Bank doesn't even place it in the low-income band where the African countries in the ranking fall.

    Frequently asked questions

    What is the poorest country in the world?

    It depends on the indicator. By nominal GDP per capita, according to the IMF's 2026 estimates, it's Yemen, at around $384; by Human Development Index, according to the UNDP, it's South Sudan, with an HDI of 0.388 for 2023.

    Which countries have the lowest GDP per capita in the world?

    According to the IMF database (2026 estimates), at the bottom of the ranking are Yemen, South Sudan, Burundi, Central African Republic, Mozambique, Madagascar, Malawi, Somalia, Niger, Sudan, Sierra Leone, Gambia, Liberia, Ethiopia and the Democratic Republic of Congo, plus Afghanistan (2025 figure). Except for Yemen and Afghanistan, they're all Sub-Saharan African countries.

    Why are most of the poorest countries in the world in Africa?

    The World Bank reports that Sub-Saharan Africa held 70% of the world's extreme poor in 2024, with projections showing growth to almost 80% by 2030. Among the factors the World Bank links to this concentration is state fragility: by 2030, nearly 60% of people in extreme poverty worldwide would live in countries classified as fragile.

    Is Moldova really the poorest country in Europe?

    It's described that way when compared with other European countries, but the World Bank doesn't place it in the low-income band: its GDP per capita in 2026 is estimated by the IMF at $9,354, far higher than the African countries at the bottom of the world ranking, and its HDI (0.785) falls in the high human development band.

    How is the Human Development Index calculated?

    The UNDP combines three indicators with a geometric mean: how long and healthily people live, how many years of schooling they get on average, and how much gross national income there is per person.

    Sources

    • World Bank — Who moves up and why? A closer look at the 2026-2027 World Bank Group country income classifications
    • World Bank — World Bank Country and Lending Groups
    • IMF — World Economic Outlook Database, indicator NGDPDPC
    • UNDP — Human Development Report 2025, Statistical Annex, Table 1
    • UNDP — Human Development Index (Data Center)
    • World Bank — When poverty meets fragility
    • Wikipedia — Economy of Moldova

    Every Recap goes through an independent review before publication.

    Every evening, the day's new Recaps on our Telegram channel. Join the channel →

    Keep learning

    • Economics Sustainability: Definition, What It Means and the Three Pillars Sustainability, in the fuller phrase sustainable development, is development that covers the needs of the people living now while leaving future generations able to cover their own: that is how the United Nations defines it. The wording comes from Our Common Future, the report published in 1987 by the World Commission on Environment and Development, also called the Brundtland Commission. Treccani lists three interdependent factors behind the expression. The United Nations describe an integrated approach, where environmental concerns travel alongside economic development. Read the Recap →
    • Economics 2008 Financial Crisis: Timeline of How It Started and Spread The 2008 financial crisis began in the United States in the subprime mortgage market, when expanding credit to riskier borrowers and the practice of bundling those mortgages into securities collided with slowing home prices, according to the Federal Reserve. In spring 2008 the investment bank Bear Stearns was rescued with Federal Reserve support, but that September Lehman Brothers filed for bankruptcy and the insurer AIG had to be propped up by the government. Washington responded with TARP, a program Congress authorized for up to $700 billion, and with new bank-supervision rules in 2010. US GDP fell 4.3% and unemployment climbed to about 10%, while in Europe the shock turned, in the following years, into a public-finance crisis that the European Central Bank had to address with government bond purchases. Read the Recap →
    • Economics Fastest Growing Economies in the World: The Real GDP Growth Ranking, Explained According to the International Monetary Fund's projections for 2025, South Sudan tops the ranking for real GDP growth, followed by Guyana and Libya — small economies, or ones tied to a single resource, not the world's biggest ones. GDP growth rate measures, in percentage terms, how much a country's output expands each year, adjusted for inflation. Global real GDP grew 3.4% in 2024 according to the IMF, with emerging economies expanding at more than double the pace of advanced ones. A very high growth rate, though, can come from a rebound after a slump, an oil boom, or even an accounting quirk: on its own, it doesn't prove a stronger economy. Read the Recap →

    recaplica

    Clear in 30 seconds, yours in 10 minutes.

    Recaps Mind maps Request a Recap Telegram channel Mind map maker Our method About Privacy & cookies Legal notes & terms of use

    © 2026 Recaplica · A project by Curi S.r.l. — VAT IT05472000750

    Statistics, only if you say so

    To learn which Recaps help most we would use Google Analytics, with aggregate, anonymous data. It starts only with your OK, and you can change your mind anytime. Privacy policy