Skip to content
recaplica

    One moment: security check

    Cloudflare wants to make sure you're not a robot. Tick the box below and your search will continue on its own.

    IT
    recaplica Biggest Economies in the World: The Ranking by GDP, Explained
    © 2026 Recaplica · recaplica.com — All rights reserved
    Home › Economics

    Biggest Economies in the World: The Ranking by GDP, Explained

    By Recaplica Newsroom · Updated on September 29, 2026

    What to print

    Page numbers appear when printing with default margins.

    Slides

    Choose a cut

    Flash10 slidesThe essential thread, to present in classFull18 slidesEvery chapter and the deeper detail

    Both come with speaker notes.

    Telegram channel
    recaplica Clear in 30 seconds, yours in 10 minutes.
    In 30 seconds Key points Figures Deep dive Slides Myths Mind map Quiz Flashcards FAQ

    In 30 seconds quick read

    In 2024, according to World Bank data, the United States remains the country with the highest nominal GDP in the world, ahead of China. Measured instead at purchasing power parity (PPP), which accounts for differences in price levels between countries, the ranking flips and China moves into first place. Nominal GDP reflects the weight of an economy on international markets in current dollars; PPP GDP reflects the domestic purchasing power of a country's residents. The two measures tell different stories, which is why the same economy can rank differently depending on which one you check.

    Key Points

    • In 2024 the United States has the highest nominal GDP in the world, at $29.298 trillion according to the World Bank.
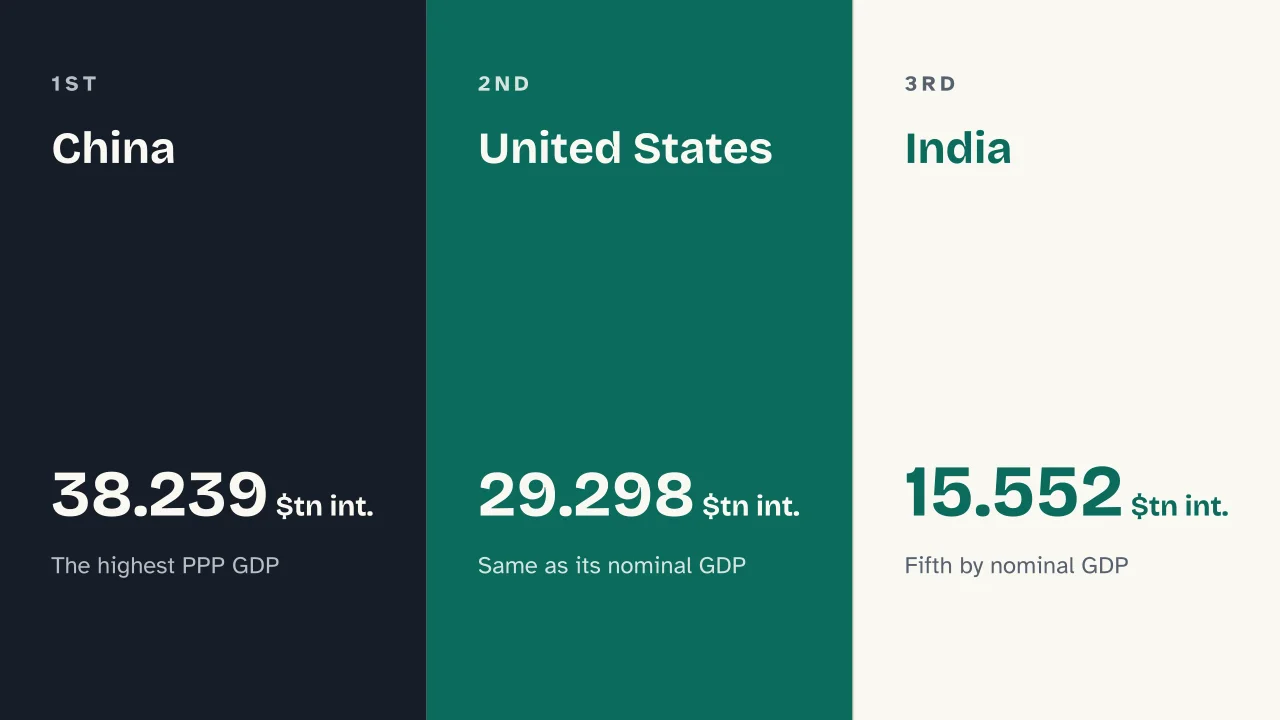
    • Measured at purchasing power parity (PPP), China leads instead, at $38.239 trillion international dollars.
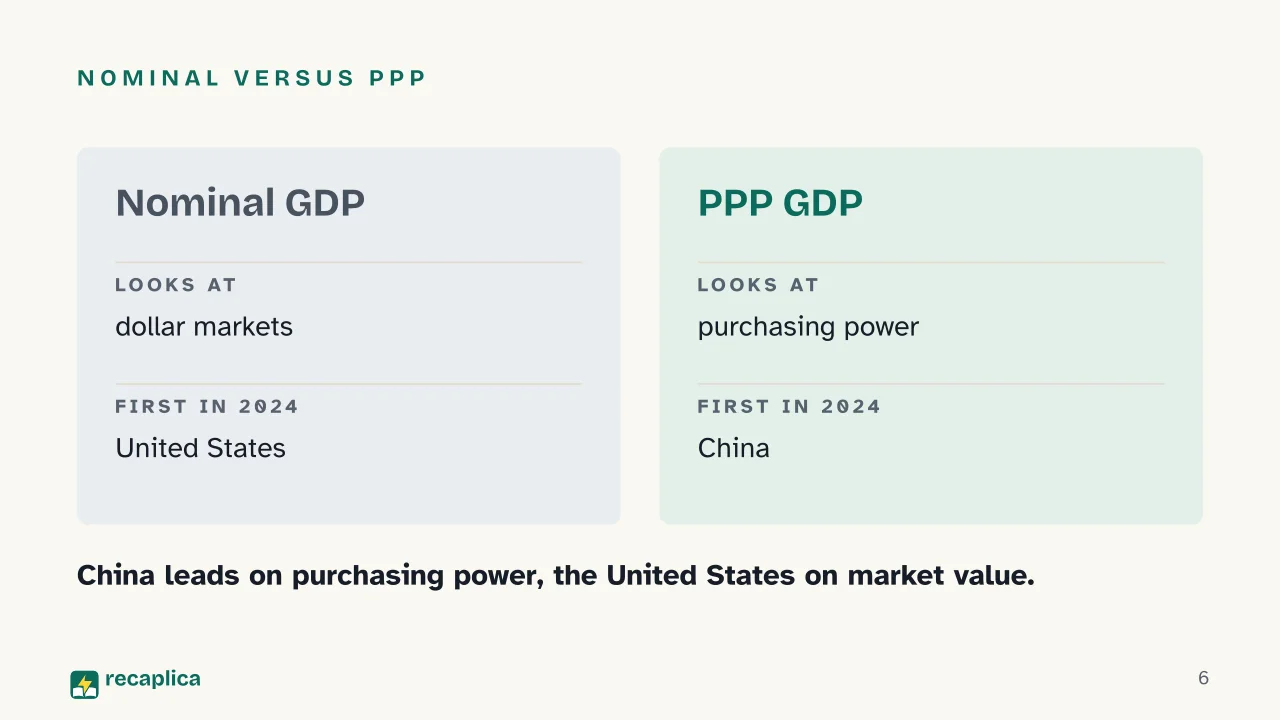
    • Nominal GDP converts values into current dollars; PPP GDP adjusts for the different price levels across countries.
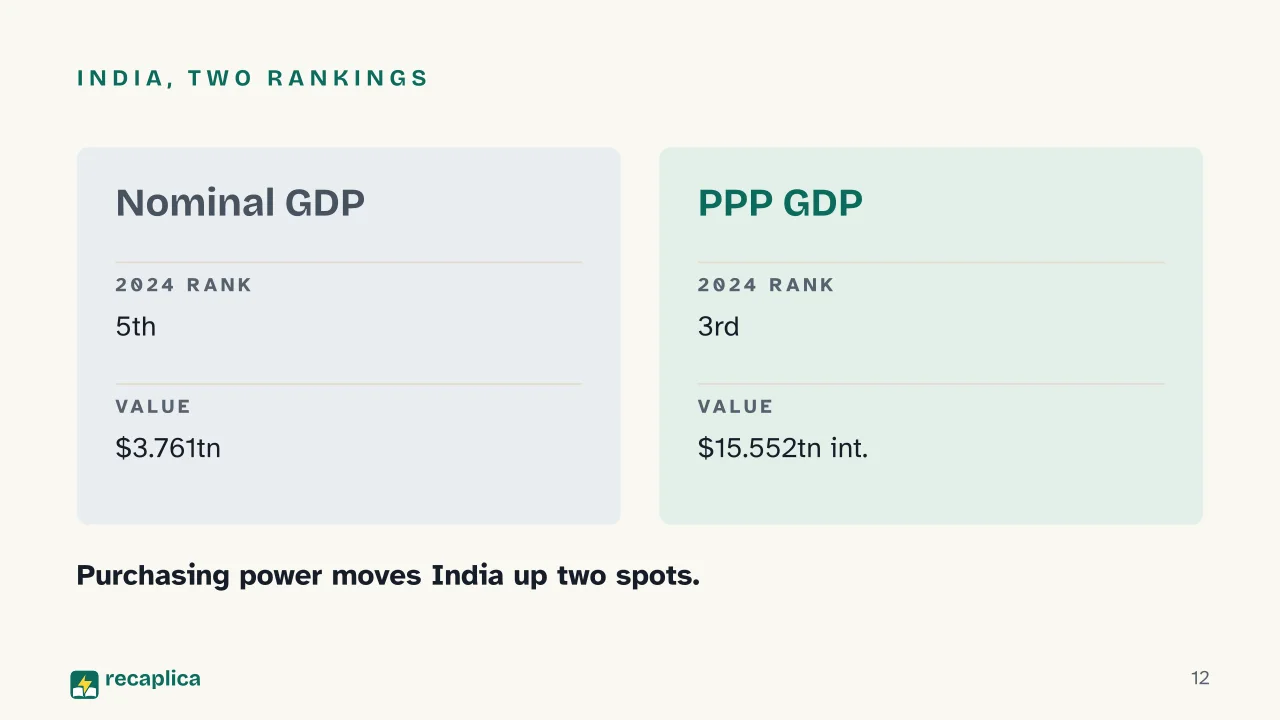
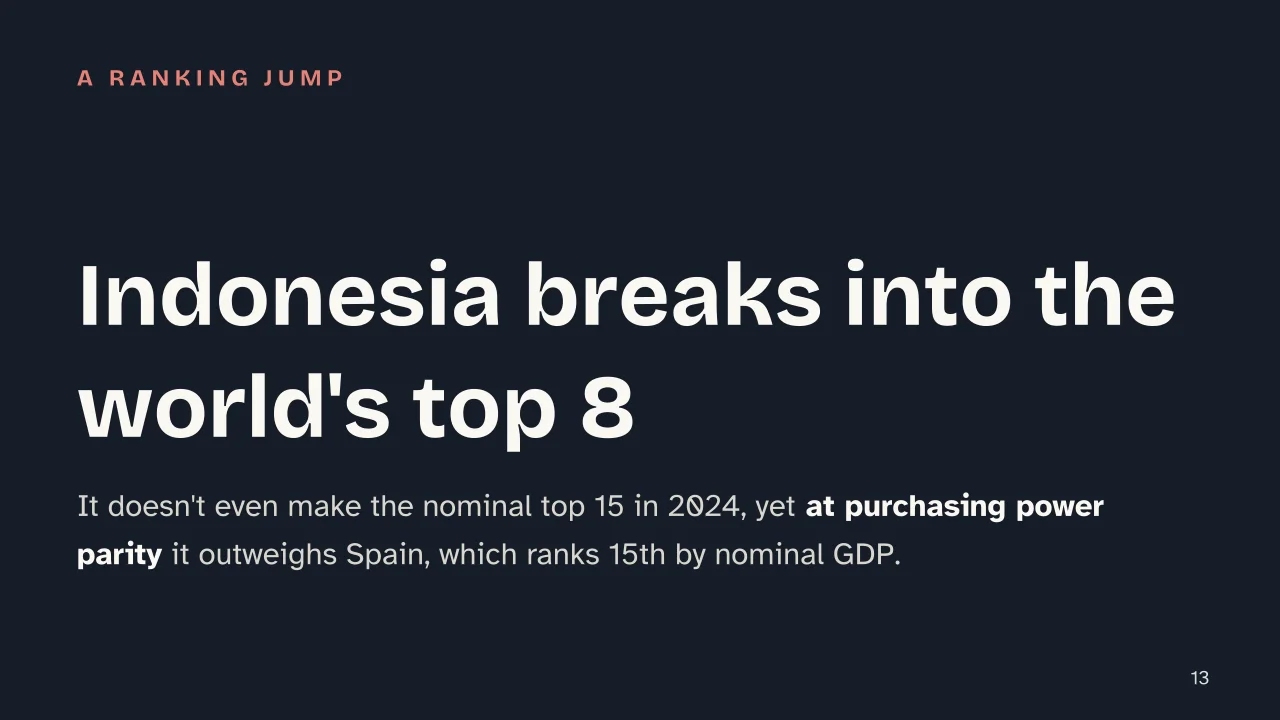
    • India ranks 5th by nominal GDP but 3rd by PPP; Indonesia only reaches the world's top 8 under the PPP measure.
    • In 2024, Canada, Russia and Brazil hold the 9th, 10th and 11th spots by nominal GDP, separated by less than $90 billion.
    • China overtook Japan in nominal GDP in 2010, according to the World Bank's historical series.

    Key figures

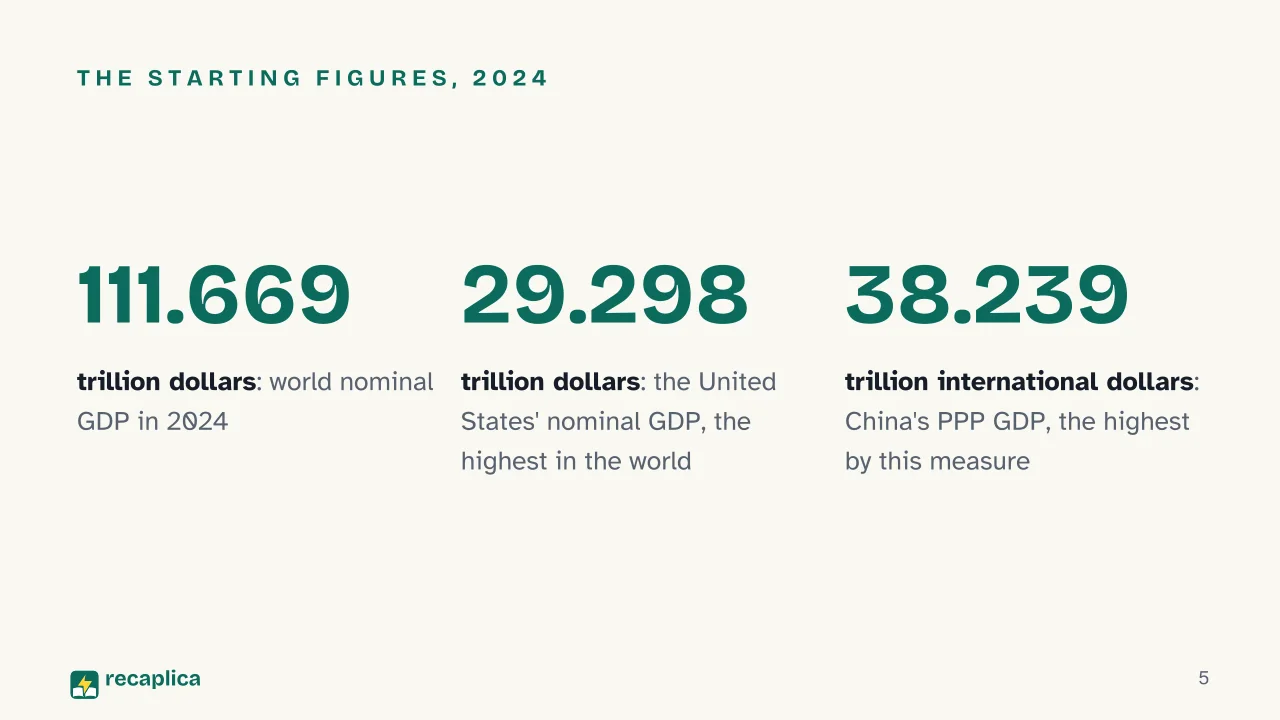
    • $111.669 trillion World nominal GDP in 2024 Source: World Bank (World Bank Open Data), 2024
    • $29.298 trillion The United States' nominal GDP in 2024, the highest in the world Source: World Bank, 2024
    • $38.239 trillion int. China's GDP at purchasing power parity in 2024, the highest by this measure Source: World Bank, 2024

    Deep Dive

    Two ways to measure the same thing

    GDP, gross domestic product, measures the value of everything a country produces in a year; we cover the basics in GDP: what it is, how it’s calculated and what it really tells us. Once you start comparing different economies against each other, though, the same figure can be read in two ways. The first is nominal GDP, the value converted into current dollars at the market exchange rate. The second is GDP at purchasing power parity (PPP): according to the World Bank, it recalculates each country’s output using a shared set of prices, so a dollar buys roughly the same basket of goods everywhere, rather than moving with the market exchange rate.

    Practical example: a haircut or a restaurant meal costs less, in dollars, in many Asian countries than in the United States. PPP GDP accounts for that gap in domestic prices; nominal GDP doesn’t, and simply adds up the value produced converted at the market exchange rate.

    The top 10 economies in the world by nominal GDP (2024)

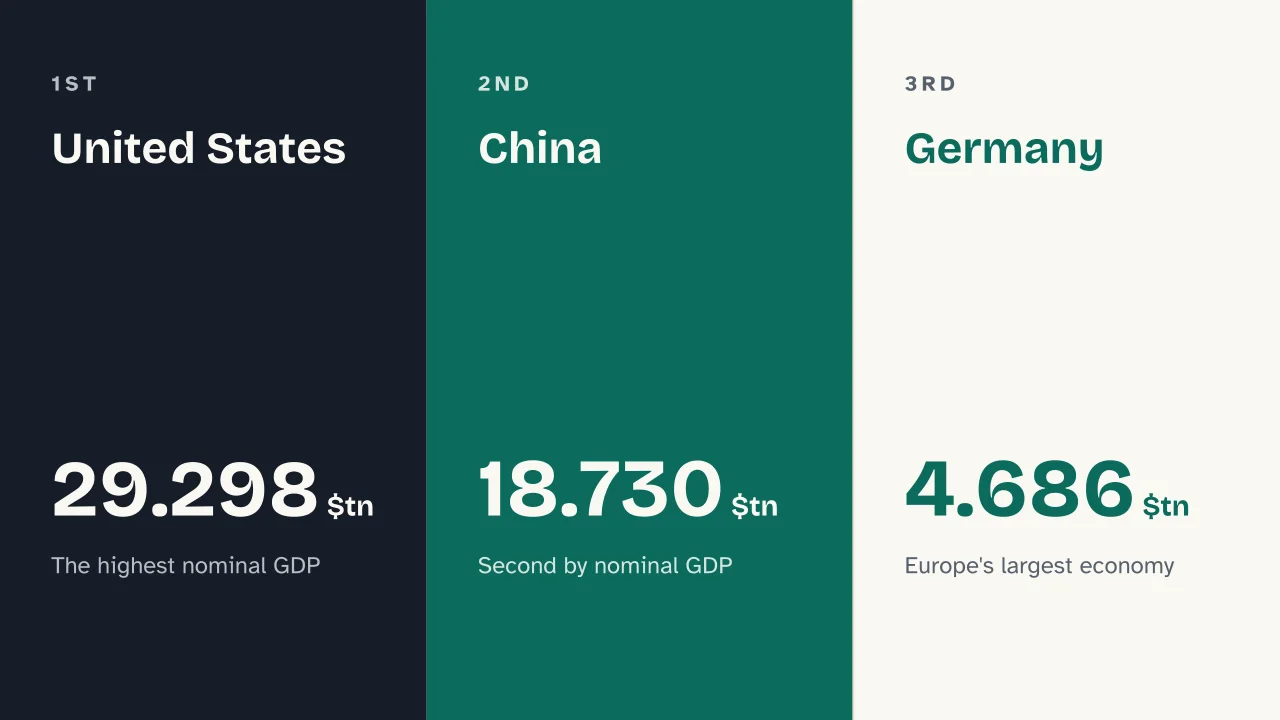
    According to World Bank data, in 2024 the United States remains the top economy in the world by nominal GDP, at $29.298 trillion, ahead of China, at $18.730 trillion. Next come Germany ($4.686 trillion), Europe’s largest economy, Japan ($4.190 trillion) and India ($3.761 trillion). Further down the top 15 sit the United Kingdom, France, Italy, Canada, Russia, Brazil, South Korea, Mexico, Australia and Spain, which closes out the top 15 at $1.726 trillion. Four of these fifteen countries, Germany, France, Italy and Spain, belong to the European Union, whose shared economic architecture is explained in how the European Union works.

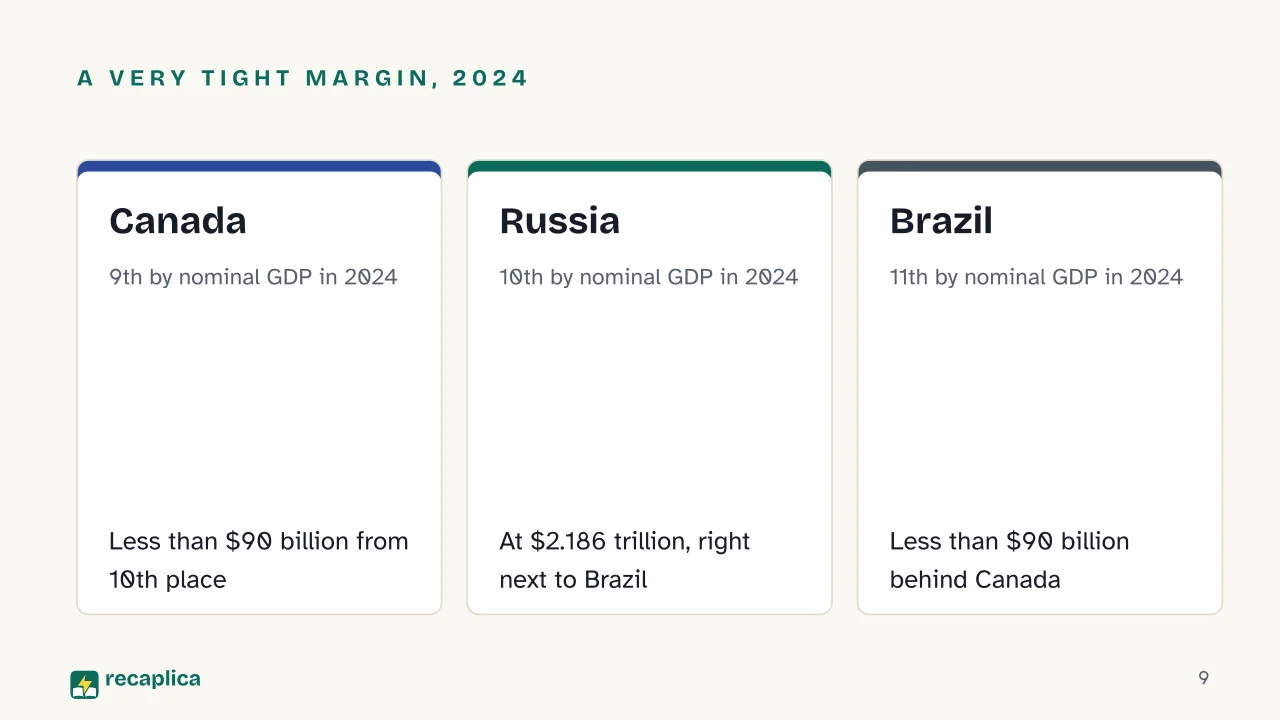
    Between 9th and 11th place in 2024, the gap is razor-thin. Canada, Russia and Brazil are separated by less than $90 billion, on economies each worth over $2 trillion. With a gap that size, next year’s data could easily swap the order of these three — a sign of how much less settled that part of the table is compared with the top.

    Top 10 by purchasing power parity in 2024

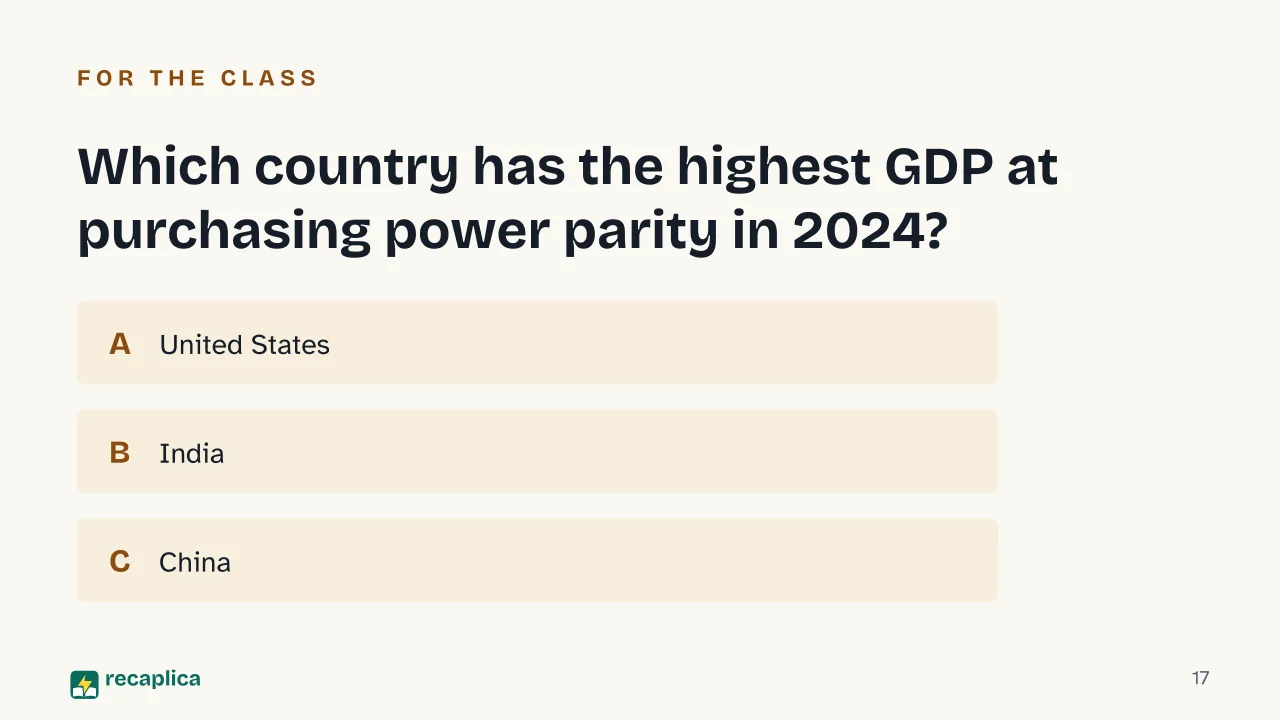
    Switch to GDP at purchasing power parity and the order changes quite a bit. In 2024 China ranks first, at $38.239 trillion international dollars. The United States stays second: by definition its PPP GDP matches its nominal GDP, since the US dollar is the reference currency for the conversion. India climbs to third place, at $15.552 trillion, Russia to fourth at $6.969 trillion despite being only tenth by nominal GDP, and Japan slips to fifth. Indonesia, which doesn’t even appear in the nominal top 15, reaches the world’s top 8 by PPP, at $4.670 trillion international dollars, a figure higher than the nominal value of Spain, 15th in the other ranking.

    RankCountry (nominal GDP)Country (PPP GDP)
    1United StatesChina
    2ChinaUnited States
    3GermanyIndia
    4JapanRussia
    5IndiaJapan
    6United KingdomGermany
    7FranceBrazil
    8ItalyIndonesia
    9CanadaUnited Kingdom
    10RussiaFrance

    Why the ranking changes

    The two measures answer different questions: how much an economy is worth when goods and capital change hands in current dollars, and how much that output is worth to the people who live there, once local price differences are stripped out. It’s the same logic behind international trade: the markets where goods and currencies change hands use the nominal exchange rate, not one adjusted for domestic prices.

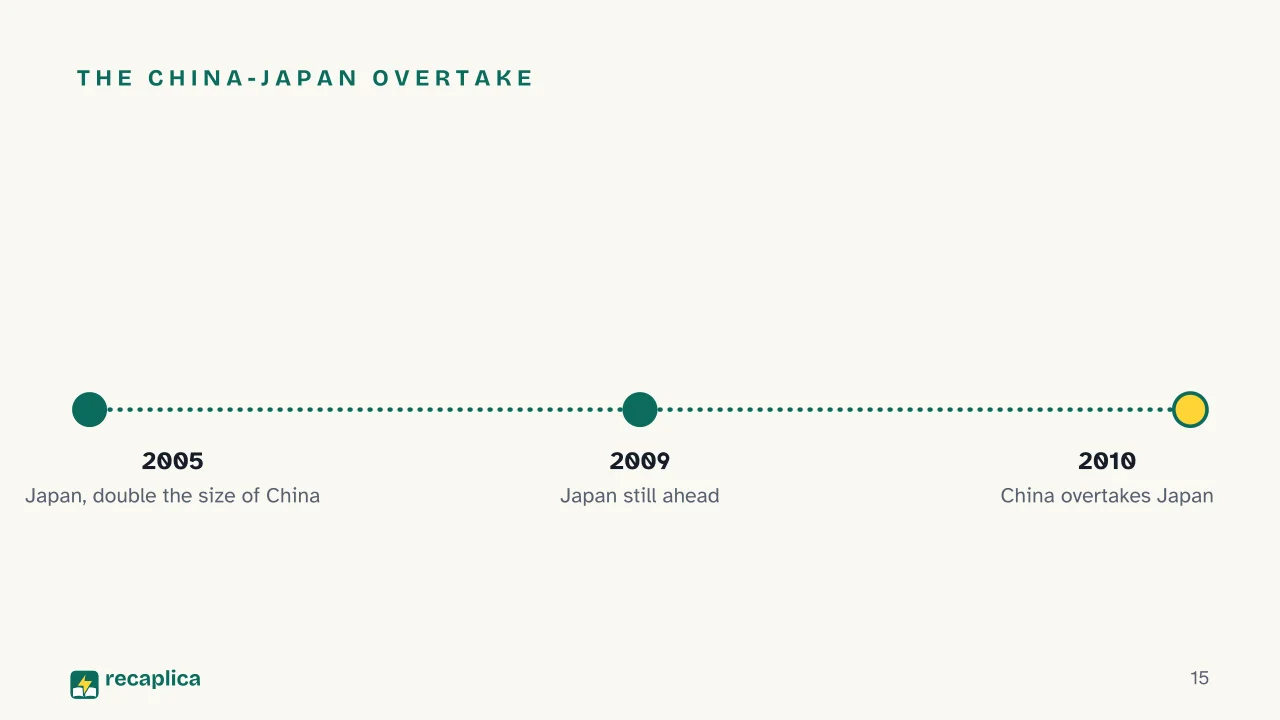
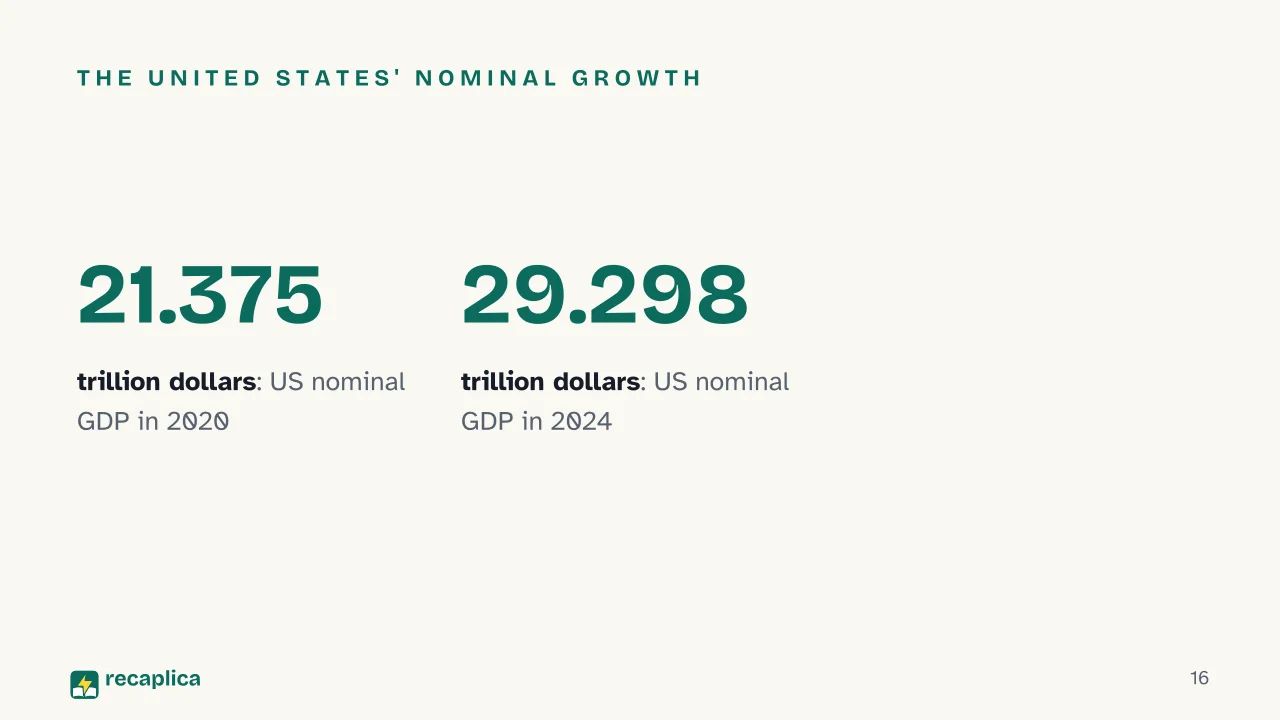
    The ranking also shifts over time, not just depending on the measure. In 2005 Japan’s nominal GDP was worth more than double China’s: $4.876 trillion against $2.318 trillion. Five years later the roles had nearly reversed; in 2009 Japan was still ahead, $5.337 trillion against $5.190 trillion, but in 2010 China overtook it, $6.193 trillion against $5.812 trillion, becoming the world’s second-largest economy by nominal GDP, a spot it still held in 2024. Absolute values grow over the years too: US nominal GDP rose from $21.375 trillion in 2020 to $29.298 trillion in 2024, a steady year-on-year climb that reflects both real output and rising prices, a phenomenon covered in inflation: what it is, how it works and why prices rise.

    Ranking among the world’s biggest economies by GDP says nothing, on its own, about a country’s public finances: the size of an economy and the level of its public debt are two separate measures, and a country can rank high on one and not on the other.

    Slide deck

    Slides ready to download and make your own in PowerPoint or Google Slides, with speaker notes. Pick the Flash cut or the Full one.
    Slide 1 of the presentation on Biggest Economies in the World: Biggest economies in the worldSlide 2 of the presentation on Biggest Economies in the World: Which country has the biggest economy in the world?Slide 3 of the presentation on Biggest Economies in the World: In this RecapSlide 4 of the presentation on Biggest Economies in the World: Chapter 01: Two ways to measureSlide 5 of the presentation on Biggest Economies in the World: The starting figures, 2024Slide 6 of the presentation on Biggest Economies in the World: Nominal versus PPPSlide 7 of the presentation on Biggest Economies in the World: Chapter 02: Nominal GDP in 2024Slide 8 of the presentation on Biggest Economies in the World: United States · China · GermanySlide 9 of the presentation on Biggest Economies in the World: A very tight margin, 2024: Canada, Russia, BrazilSlide 10 of the presentation on Biggest Economies in the World: Chapter 03: GDP at purchasing power paritySlide 11 of the presentation on Biggest Economies in the World: China · United States · IndiaSlide 12 of the presentation on Biggest Economies in the World: India, two rankingsSlide 13 of the presentation on Biggest Economies in the World: Indonesia breaks into the world's top 8Slide 14 of the presentation on Biggest Economies in the World: Chapter 04: Why the ranking changesSlide 15 of the presentation on Biggest Economies in the World: The China-Japan overtakeSlide 16 of the presentation on Biggest Economies in the World: The United States' nominal growthSlide 17 of the presentation on Biggest Economies in the World: Which country has the highest GDP at purchasing power parity in 2024?Slide 18 of the presentation on Biggest Economies in the World: Want to know more?
    Flash10 slidesThe essential thread, to present in classFull18 slidesEvery chapter and the deeper detail

    Common myths

    • ✗ Myth The country with the highest GDP is also the richest per person

      ✓ Reality GDP measures the total size of an economy, not the average income of the people living in it: a country with a huge GDP and a very large population can end up with less per person than a country whose economy is smaller overall.

    • ✗ Myth The GDP ranking of countries never really moves from year to year

      ✓ Reality It shifts on two fronts: over time, since China overtook Japan in nominal GDP back in 2010 according to the World Bank; and between neighboring countries in a given year, since in 2024 Canada, Russia and Brazil were separated by less than $90 billion.

    • ✗ Myth Nominal GDP and PPP GDP always put a country in the same spot

      ✓ Reality They can diverge sharply: in 2024 China ranks second by nominal GDP but first by PPP, and Indonesia reaches the world's top 8 only under the PPP measure, staying outside the nominal top 15 entirely.

    Mind map

    Drag the background to move around and the nodes to reposition them; use − and + to collapse and expand branches.
    Customize
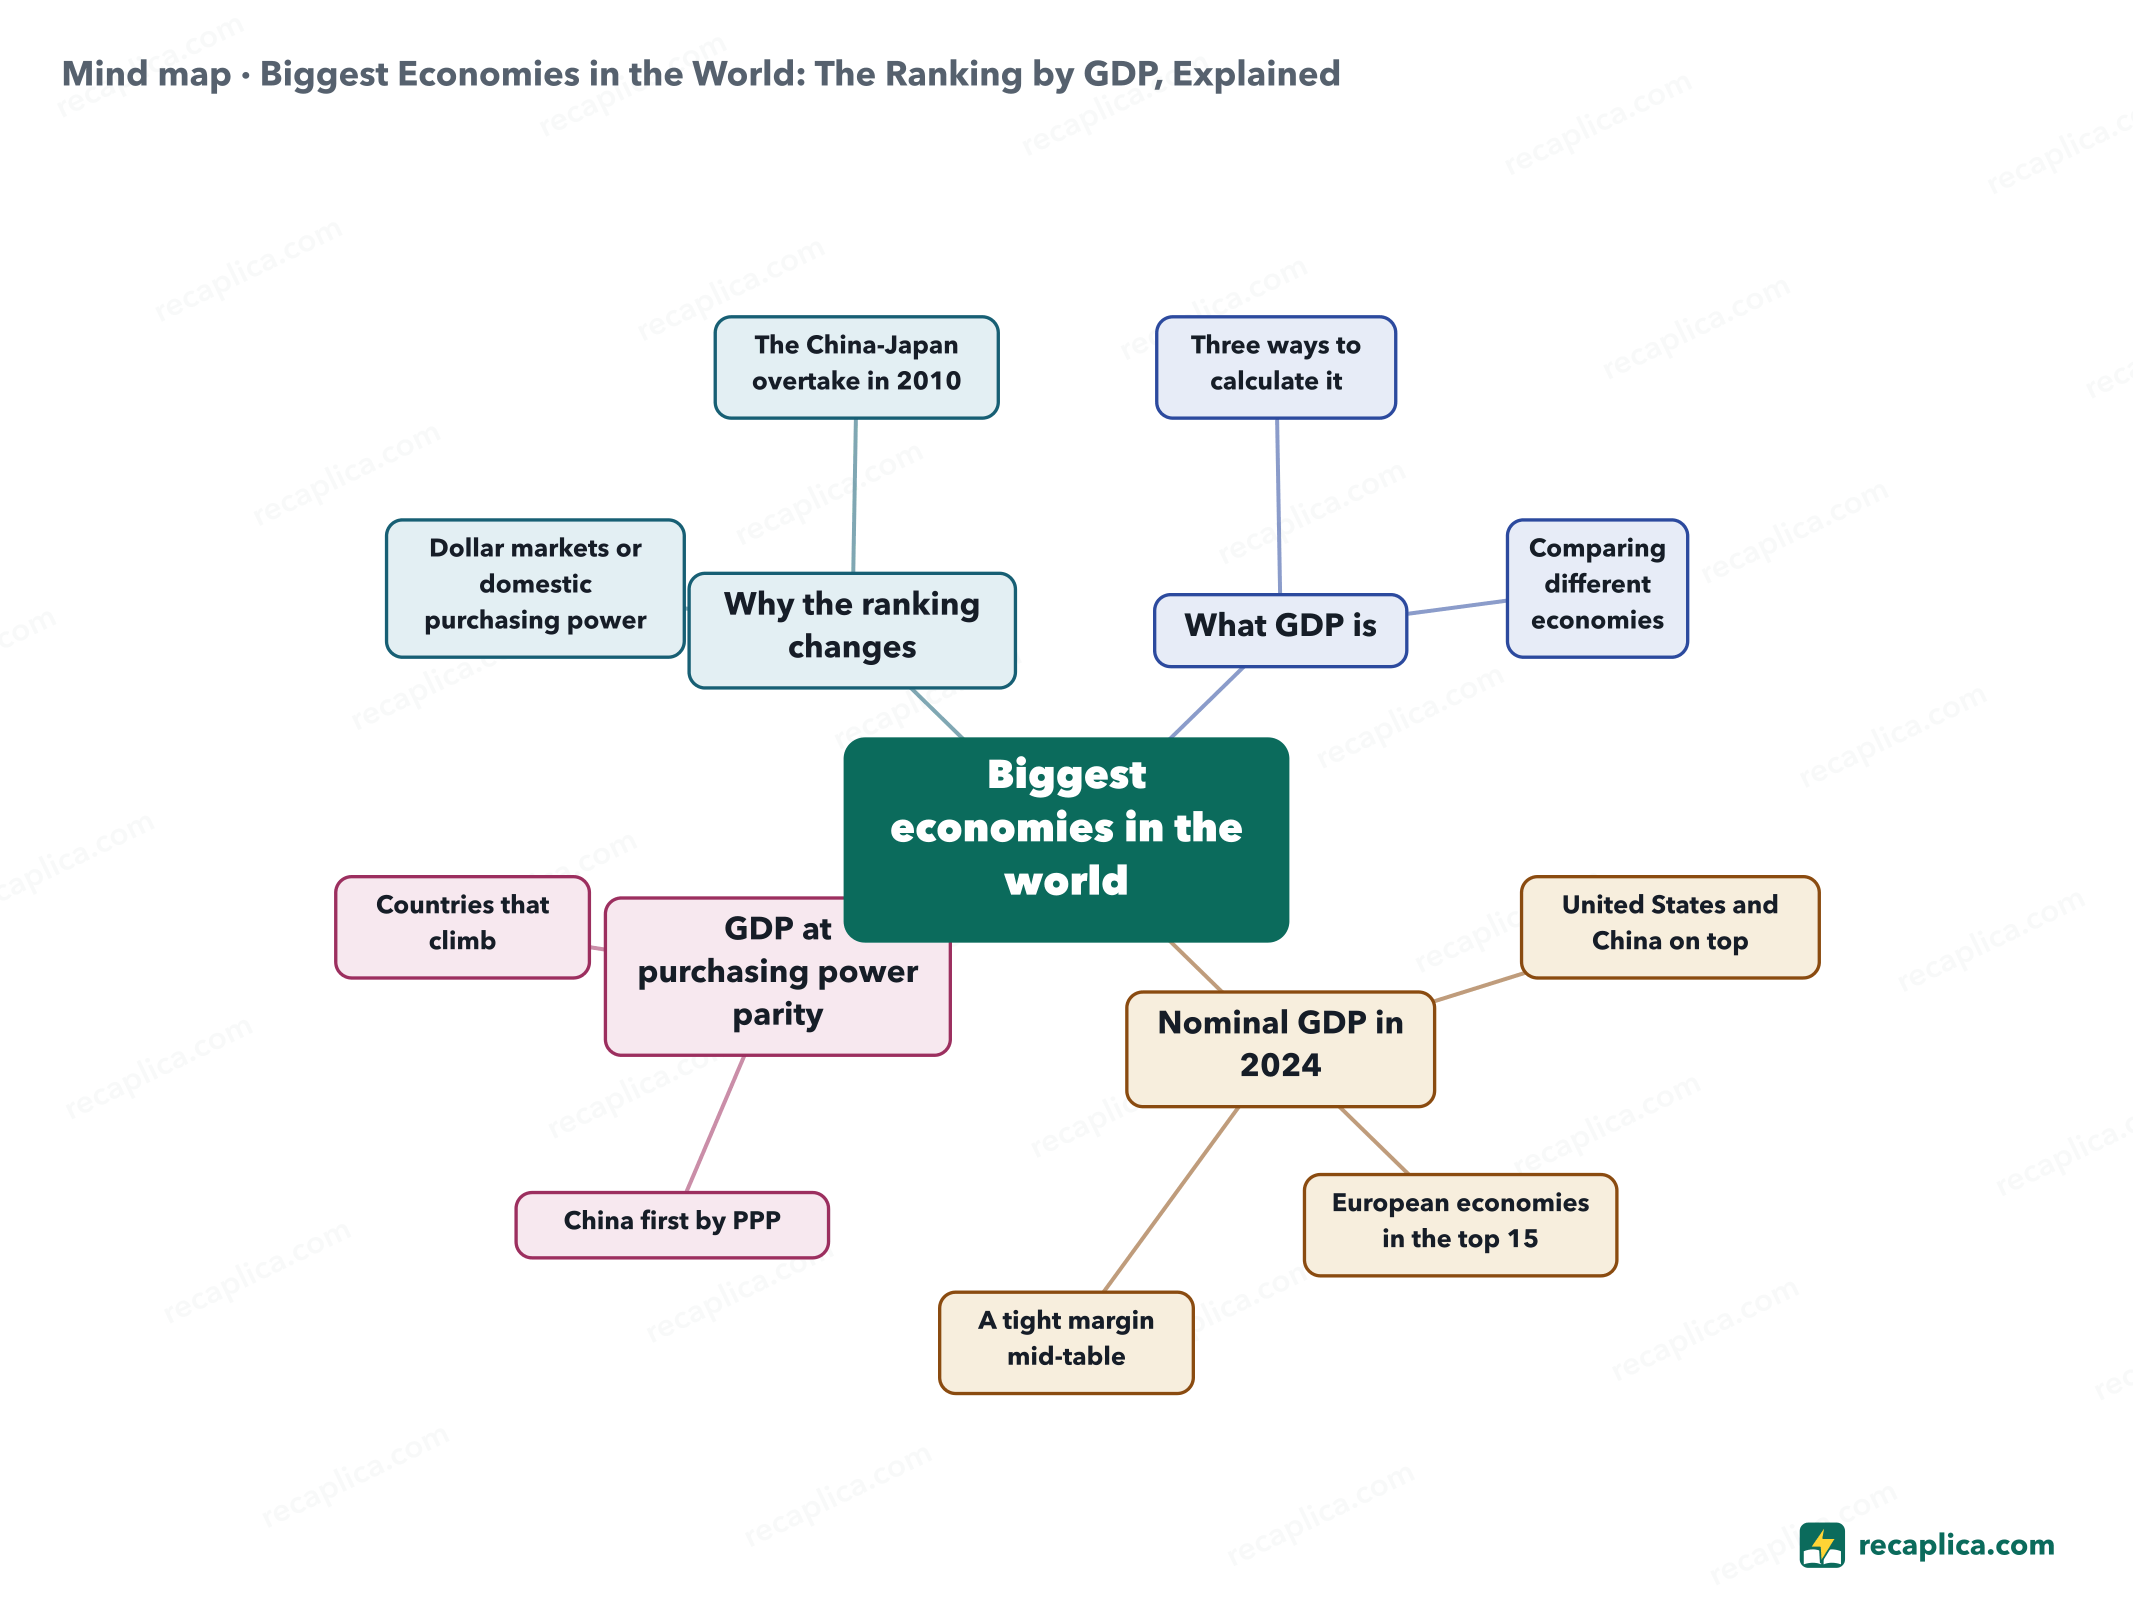
    Mind map: Biggest Economies in the World: The Ranking by GDP, Explained
    • Biggest economies in the world
      • What GDP is The value of everything an economy produces in a year
        • Three ways to calculate it Expenditure, income or production
        • Comparing different economies
      • Nominal GDP in 2024 Values converted at the market exchange rate
        • United States and China on top $29.298 and $18.730 trillion
        • European economies in the top 15 Germany, France, Italy, Spain
        • A tight margin mid-table Canada, Russia and Brazil
      • GDP at purchasing power parity Values adjusted for different price levels
        • China first by PPP $38.239 trillion international dollars
        • Countries that climb India, Russia, Indonesia
      • Why the ranking changes
        • Dollar markets or domestic purchasing power
        • The China-Japan overtake in 2010

    Quiz: test yourself

    Answer the questions to check what you have learned: you get instant feedback and a short explanation.

    Grade 0/10 0/5
    1 According to World Bank data, which country has the highest nominal GDP in 2024?

    The United States has the highest nominal GDP in 2024, at $29.298 trillion according to the World Bank; China ranks second.

    2 Looking instead at GDP by purchasing power parity (PPP), which country ranks first in 2024?

    By purchasing power parity, China ranks first in 2024, at $38.239 trillion international dollars, according to the World Bank.

    3 Why can GDP at purchasing power parity (PPP) produce a different ranking than nominal GDP?

    According to the World Bank, PPP GDP adjusts for how much things actually cost in each country, while nominal GDP simply uses the market exchange rate.

    4 True or false: in 2024 Canada, Russia and Brazil, ranked 9th, 10th and 11th by nominal GDP, were separated by a very wide margin, over $500 billion.

    False: according to the World Bank the margin between the three countries was less than $90 billion in 2024, on economies each worth over $2 trillion.

    5 In which year, according to the World Bank's historical series, did China's nominal GDP overtake Japan's?

    In 2010 China's nominal GDP ($6.193 trillion) overtook Japan's ($5.812 trillion); in 2009 Japan was still ahead.

    Answers: 1-B · 2-C · 3-A · 4-B · 5-C

    Flashcards

    Tap the card to flip it and check whether you remember the answer, then move to the next one.

    1 / 7

    Explain it in your own words

    The ultimate test: if you can explain it in simple words, you've truly understood it. Write your explanation, then compare it with the Recap.

    Your explanation is saved only on this device.

    In 2024, according to World Bank data, the United States remains the country with the highest nominal GDP in the world, ahead of China. Measured instead at purchasing power parity (PPP), which accounts for differences in price levels between countries, the ranking flips and China moves into first place. Nominal GDP reflects the weight of an economy on international markets in current dollars; PPP GDP reflects the domestic purchasing power of a country's residents. The two measures tell different stories, which is why the same economy can rank differently depending on which one you check.

    Frequently asked questions

    What's the difference between nominal GDP and GDP at purchasing power parity?

    Nominal GDP converts the value an economy produces into dollars at the market exchange rate. GDP at purchasing power parity (PPP) instead recalculates that value using a common price level across countries, to better compare domestic purchasing power.

    What are the top 5 biggest economies in the world by nominal GDP?

    According to the World Bank, in 2024 the top 5 by nominal GDP are: the United States, China, Germany, Japan and India.

    What are the top 10 economies in the world by nominal GDP?

    In 2024, according to the World Bank: United States, China, Germany, Japan, India, the United Kingdom, France, Italy, Canada and Russia.

    What is the 3rd largest economy in the world?

    It depends on the measure: by nominal GDP, Germany ranks third in 2024, at $4.686 trillion; by purchasing power parity, third place instead belongs to India, at $15.552 trillion international dollars, because the two rankings diverge once price levels are taken into account.

    Why is China the biggest economy in the world by PPP but only second by nominal GDP?

    Because PPP GDP adjusts China's output for its domestic price level, which is lower than that of the United States; once converted this way, China's GDP turns out higher than its nominal figure.

    Sources

    • GDP (current US$), World Development Indicators — World Bank
    • GDP, PPP (current international $), World Development Indicators — World Bank

    Every Recap goes through an independent review before publication.

    Every evening, the day's new Recaps on our Telegram channel. Join the channel →

    Keep learning

    • Economics Poverty: Definition and How It Differs from Inequality and Underdevelopment Poverty is the condition of lacking the minimum resources needed to live, and it can be measured in more than one way depending on the yardstick used. Absolute poverty is set against a fixed threshold, such as the basket of essential goods ISTAT uses in Italy or the World Bank's international line of $3 a day, while relative poverty compares a household's spending with the average in its own country. It is a distinct phenomenon from economic inequality, which Eurostat measures with the Gini index on the distribution of income, and from underdevelopment, which the United Nations Development Programme assesses with the Human Development Index by looking beyond economic growth alone. According to the World Bank, 831 million people worldwide were living in extreme poverty in 2025. Read the Recap →
    • Economics Central Bank: What It Does, How It Sets Rates, and How Money Gets Made A central bank issues legal tender and sets monetary policy, meaning the conditions under which money circulates in the economy; commercial banks take in savings and grant credit, and in doing so create the bank money people use every day to pay for things. In Italy, banking activity has been defined by the 1993 Consolidated Banking Act, and in the euro area only the European Central Bank issues legal tender. Since July 2021 the ECB has aimed for 2% inflation over the medium term, a symmetric target that guides its decisions on interest rates. Read the Recap →
    • Economics Labor Market: How Supply, Demand and Unemployment Work The labor market is where businesses that need workers to produce goods and services meet the people willing to work for them. In the textbook model, that meeting sets wages and employment levels the way any other market would, but imperfect information, bargaining power and legal rules push the real market away from pure competition. Those gaps are where unemployment comes from, and economists split it into frictional, structural, cyclical and technological types depending on the cause. Official statistics, such as Italy's ISTAT, measure it against the labor force — people employed plus people actively looking for work — not the whole population. As of July 2026, Italy's unemployment rate stood at 5.8%, provisional, against 6.4% for the euro area. Read the Recap →

    recaplica

    Clear in 30 seconds, yours in 10 minutes.

    Recaps Mind maps Request a Recap Telegram channel Mind map maker Our method About Privacy & cookies Legal notes & terms of use

    © 2026 Recaplica · A project by Curi S.r.l. — VAT IT05472000750

    Statistics, only if you say so

    To learn which Recaps help most we would use Google Analytics, with aggregate, anonymous data. It starts only with your OK, and you can change your mind anytime. Privacy policy