Skip to content
recaplica

    One moment: security check

    Cloudflare wants to make sure you're not a robot. Tick the box below and your search will continue on its own.

    IT
    recaplica GDP: what it is, how it's calculated and what it really tells us
    © 2026 Recaplica · recaplica.com — All rights reserved
    Home › Economics

    GDP: what it is, how it's calculated and what it really tells us

    By Recaplica Newsroom · Updated on August 31, 2026

    What to print

    Page numbers appear when printing with default margins.

    Slides

    Choose a cut

    Flash10 slidesThe essential thread, to present in classFull17 slidesEvery chapter and the deeper detail

    Both come with speaker notes.

    Telegram channel
    recaplica Clear in 30 seconds, yours in 10 minutes.
    In 30 seconds Key points Figures Deep dive Slides Myths Mind map Quiz Flashcards FAQ

    In 30 seconds quick read

    GDP (gross domestic product) is the value of all final goods and services produced in a country over a period. It's the economy's odometer: when it grows, the country is producing and earning more; when it falls for long enough, that's a recession. It doesn't measure everything that matters, though: housework, the environment and wellbeing stay out of the count.

    Key Points

    • GDP = the market value of all FINAL goods and services produced within a country's borders in a period.
    • It adds up consumption, investment, government spending and net exports (C + I + G + NX).
    • It counts where production happens, not who produces: a German-owned factory in Italy counts in Italian GDP.
    • Nominal GDP = at current prices; real GDP = adjusted for inflation. True growth is measured by the real one.
    • GDP per capita (GDP divided by population) lets you compare countries of different sizes.
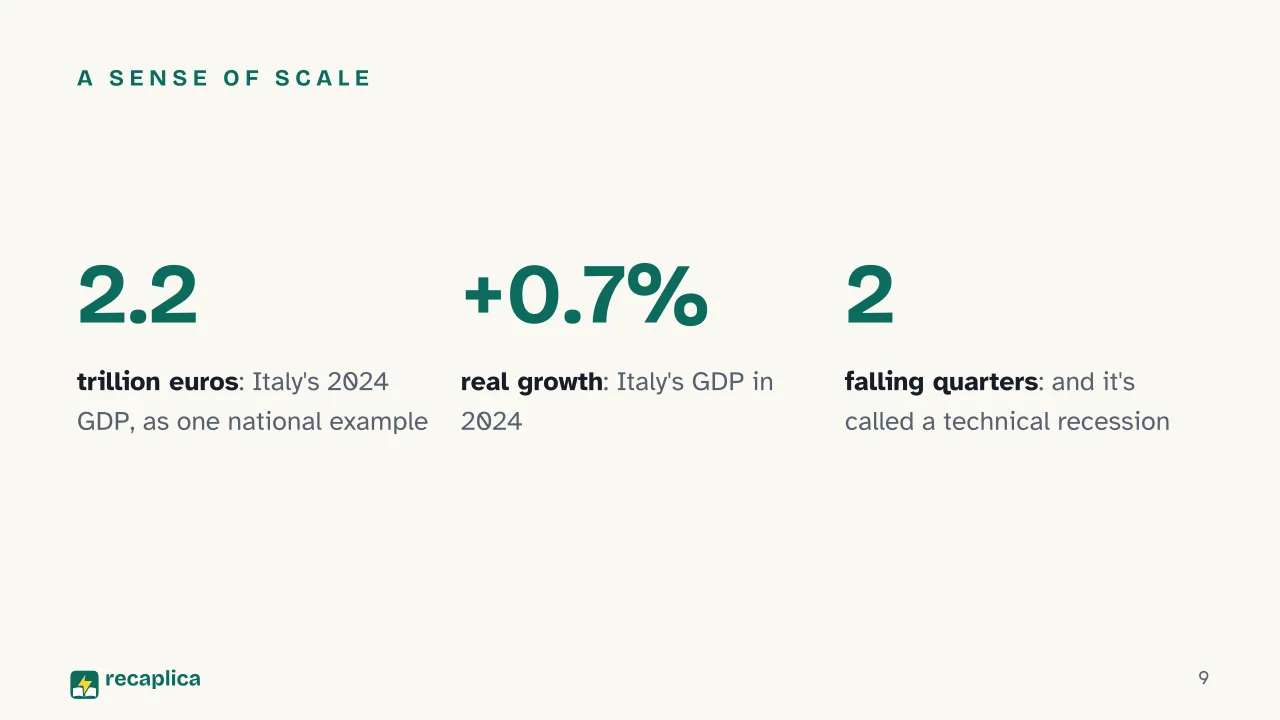
    • Italy's 2024 GDP, for scale: about €2.2 trillion.

    Key figures

    • €2,199.6bn Italy's 2024 GDP at market prices, as one national example Source: ISTAT, national accounts
    • +0.7% Italy's real GDP growth in 2024 Source: ISTAT

    Deep Dive

    The economy’s odometer

    When the news says “the economy grew 0.7%”, this is what they’re talking about: GDP, gross domestic product. It’s the value of all final goods and services produced within a country’s borders over a period, usually a year or a quarter. Think of it as the economy’s odometer: it won’t tell you where you’re headed or whether you’re enjoying the ride, but it tells you how fast you’re producing.

    Italy, to take one national example, produced goods and services worth about €2.2 trillion in 2024 (ISTAT). A huge number that becomes manageable once you take it apart.

    What goes into the count (and what doesn’t)

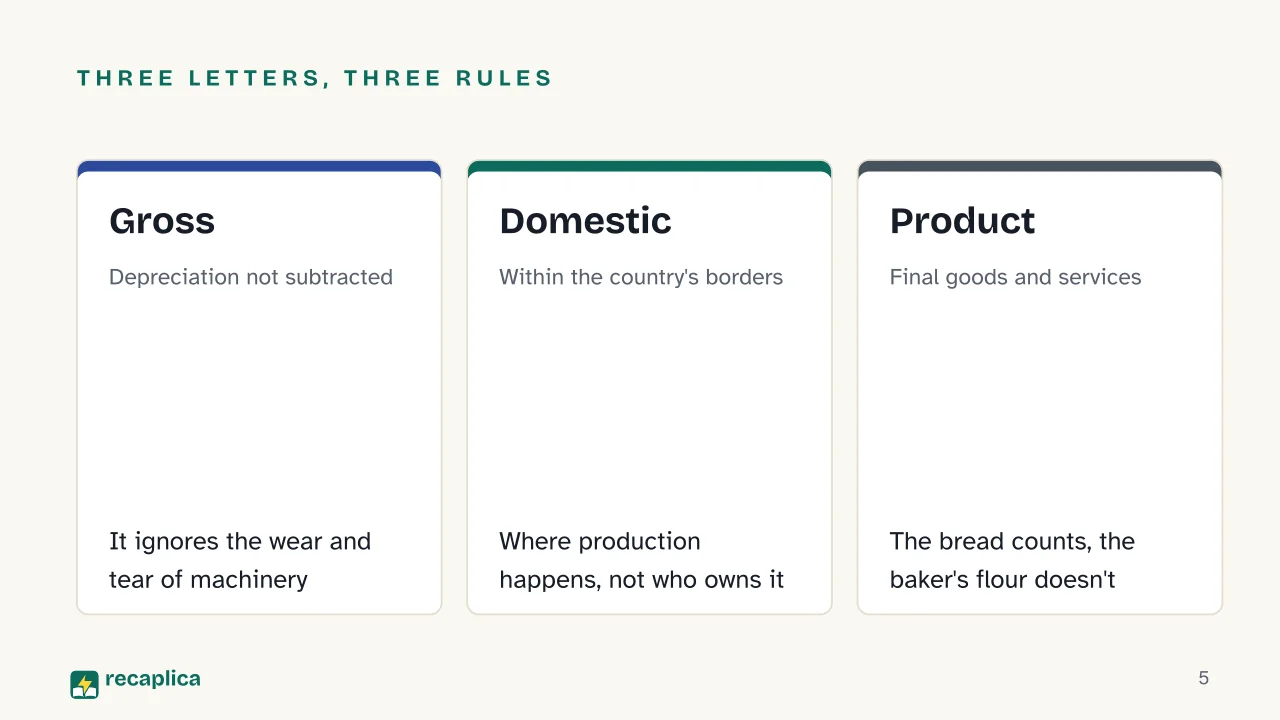
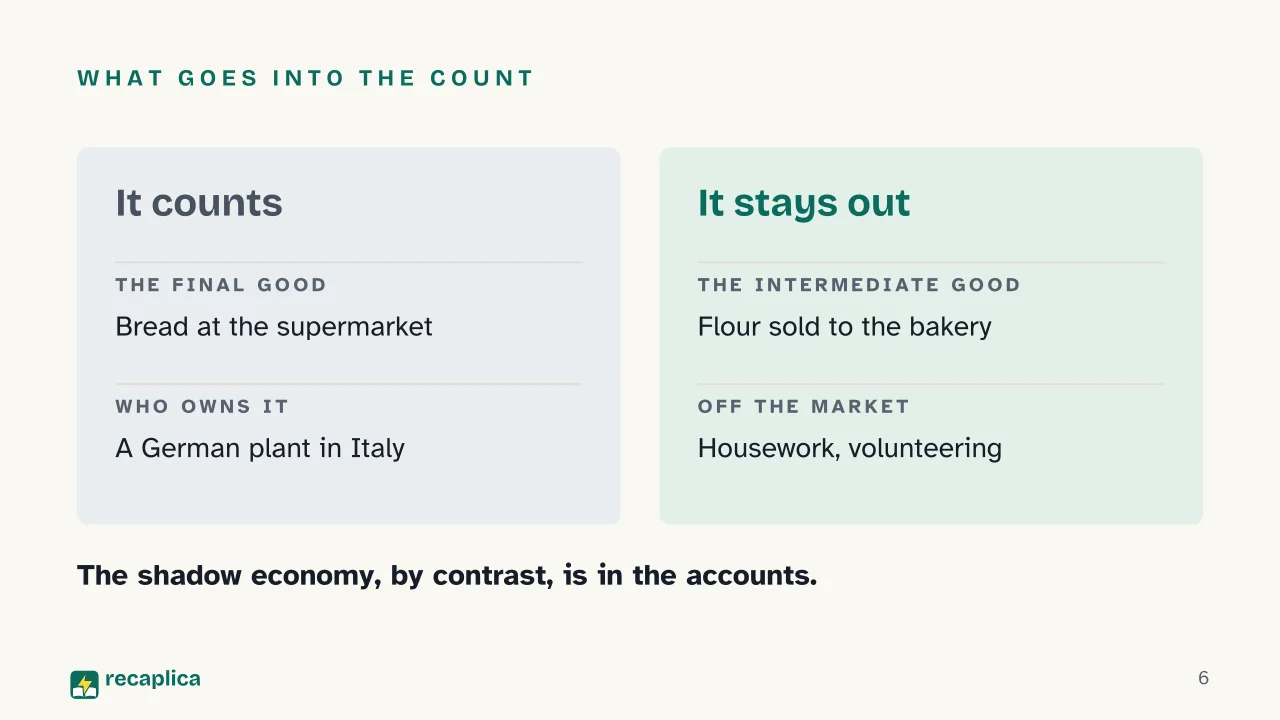
    The key word is final. The bread sold at the supermarket enters GDP; the flour sold to the bakery doesn’t, because its value is already inside the price of the bread. Counting it twice would inflate the total.

    Second rule: what matters is where production happens, not who owns it.

    Practical example: a German carmaker’s plant in Italy counts in Italian GDP. The restaurant an Italian entrepreneur opens in Berlin counts in Germany’s.

    Then there’s everything GDP can’t see. Pay someone to clean your house and GDP records the transaction; clean it yourself and, as far as GDP is concerned, nothing happened. Unpaid housework and volunteering: real value, statistically invisible. The shadow economy, by contrast, is in the accounts: statistical offices estimate it and fold it into GDP.

    The formula: four kinds of spending

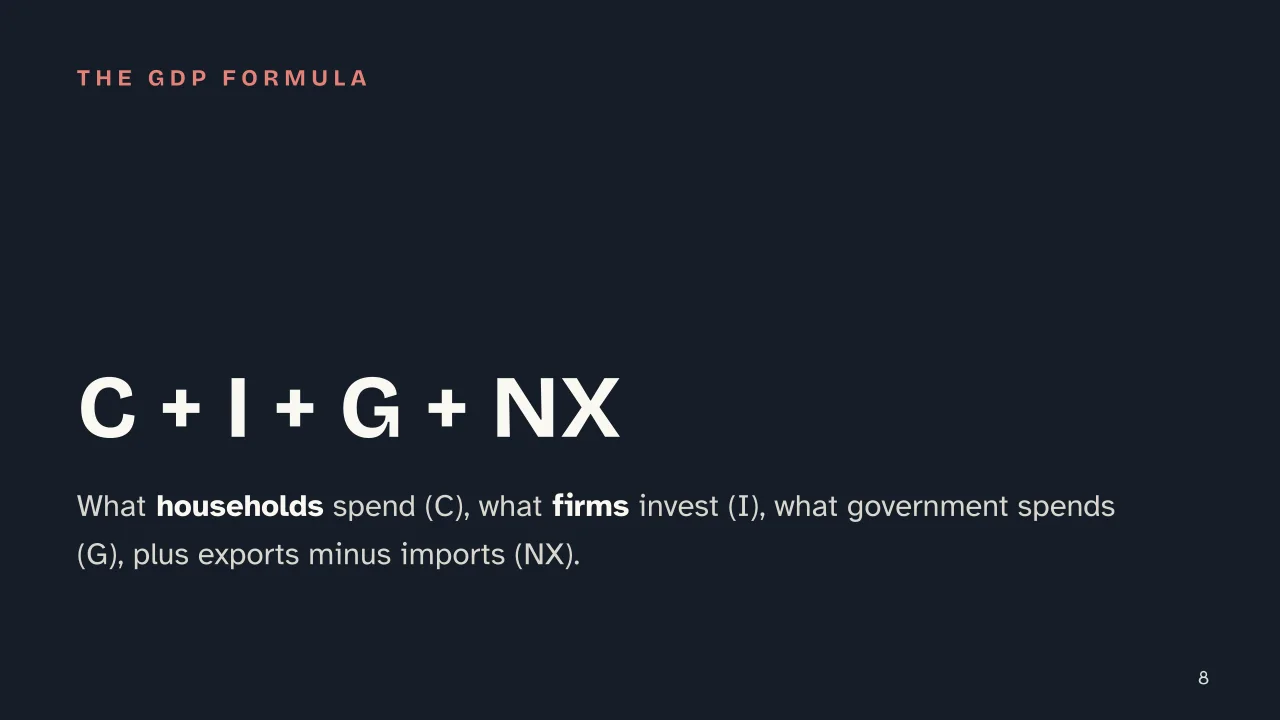
    The most quoted way to compute GDP adds up what everyone spends:

    ItemWho spendsExamples
    C — ConsumptionHouseholdsGroceries, rent, restaurants, clothes
    I — InvestmentFirmsMachinery, plants, software
    G — GovernmentThe stateSchools, hospitals, public salaries
    NX — Net exportsThe rest of the worldExports minus imports

    GDP = C + I + G + NX. More household spending, more business investment, more public spending or more foreign demand: any of them makes the odometer climb.

    Nominal vs real: the price illusion

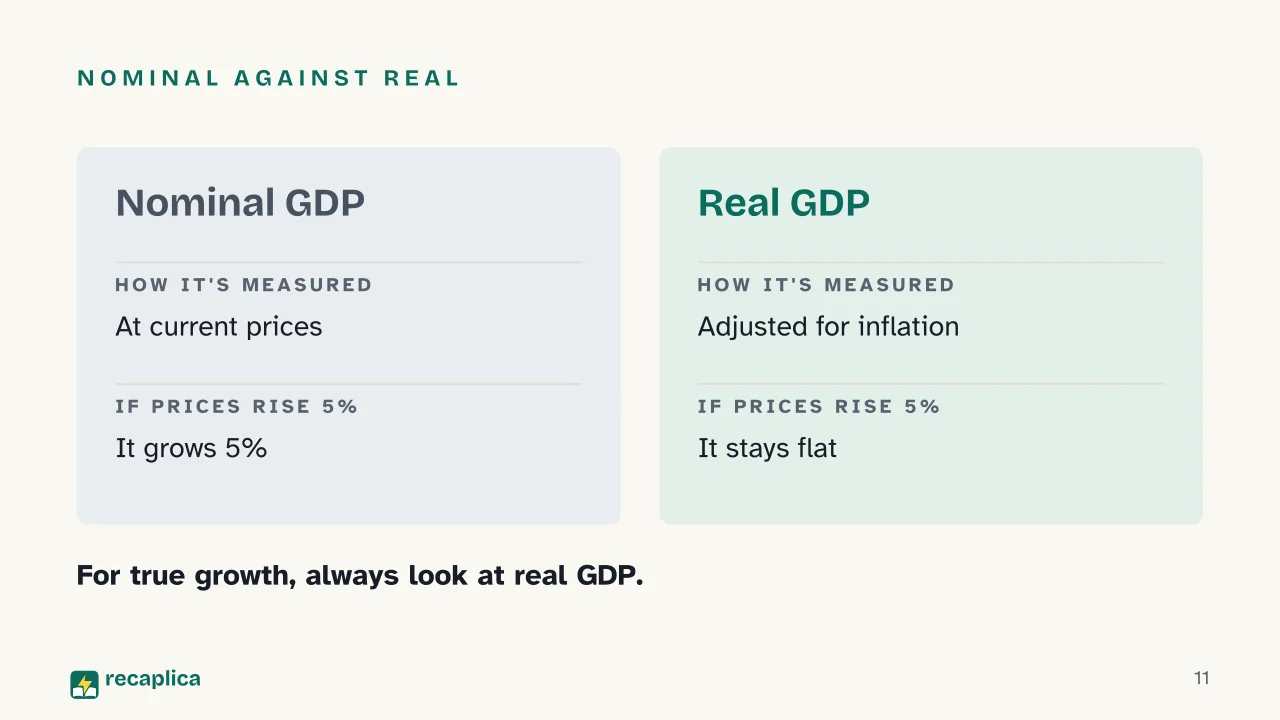
    Here GDP gets tangled with inflation. Imagine production stays identical for a year while prices rise 5%: GDP measured at current prices (the nominal one) grows 5%, yet not a single extra good was made. That’s why economists watch real GDP, scrubbed of price effects. Italy’s +0.7% in 2024 is real growth: output that actually increased.

    Per capita: the right size for comparisons

    Total GDP rewards big countries. To compare China with Switzerland you need GDP per capita: the total divided by population. Rankings change radically, and the number gets closer to what an “average share” looks like, while remaining an average, with all the limits averages have.

    Why everyone watches it

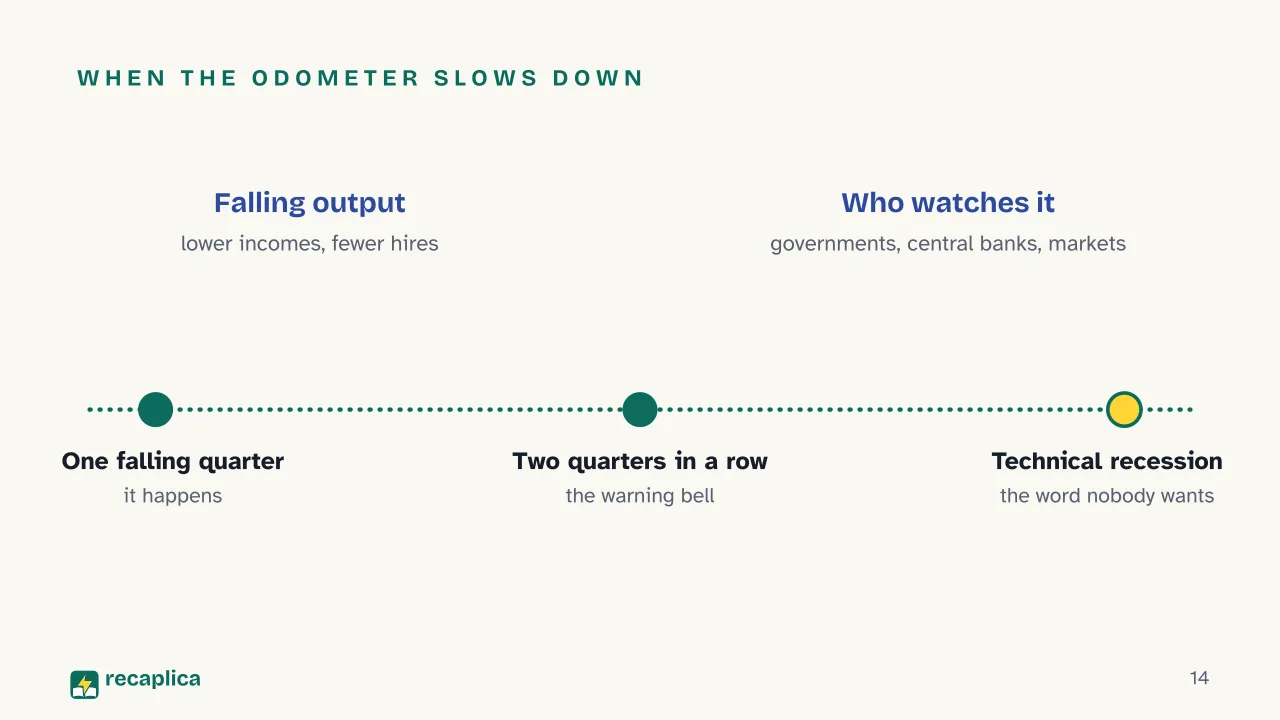
    Concrete decisions hang on GDP: governments calibrate budgets on it, central banks watch it when they move interest rates, markets react to every decimal point. And when it falls for two consecutive quarters, out comes the word nobody wants to hear: recession, at least in its “technical” version (the dedicated article explains why the serious definition asks for more).

    One caveat to keep in mind: GDP measures production, not happiness. It tells you how fast the engine is running, not whether the trip is worth taking. Use it for what it is — the best odometer we have — without asking it to be the navigation system.

    Slide deck

    Slides ready to download and make your own in PowerPoint or Google Slides, with speaker notes. Pick the Flash cut or the Full one.
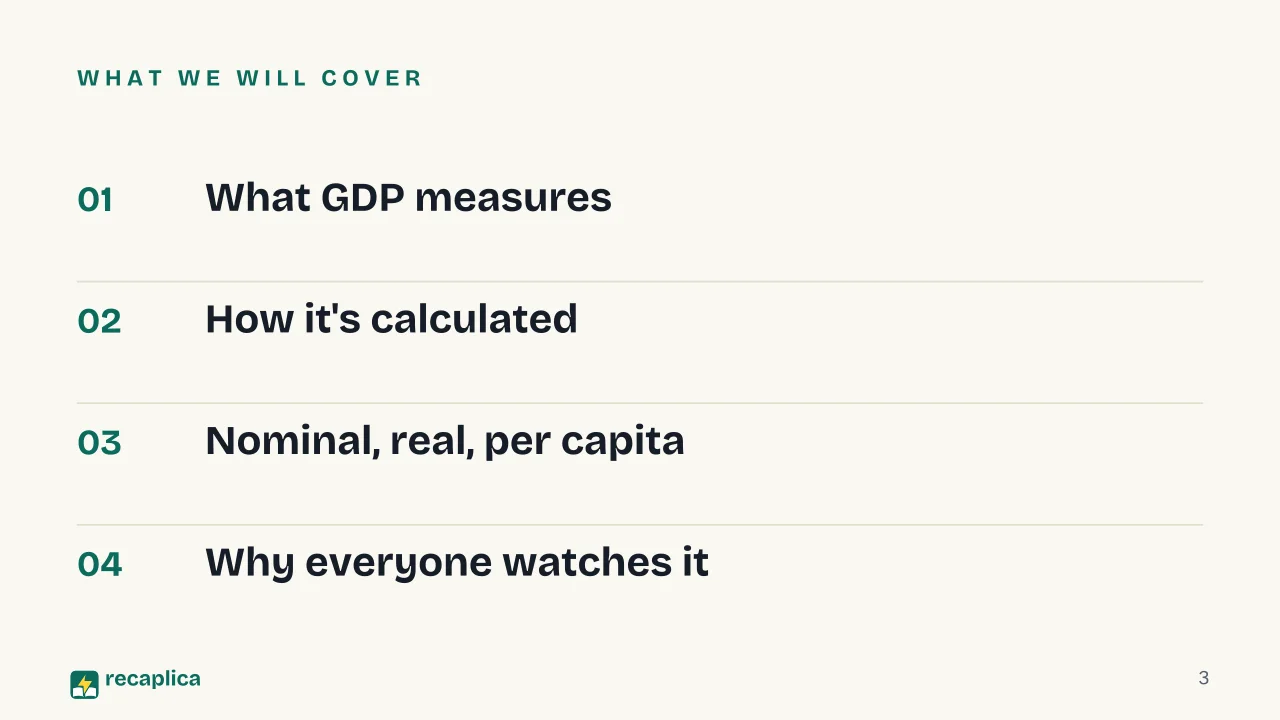
    Slide 1 of the presentation on GDP: GDPSlide 2 of the presentation on GDP: When GDP grows, what exactly is growing?Slide 3 of the presentation on GDP: What we will coverSlide 4 of the presentation on GDP: Chapter 01: What GDP measuresSlide 5 of the presentation on GDP: Three letters, three rules: Gross, Domestic, ProductSlide 6 of the presentation on GDP: What goes into the countSlide 7 of the presentation on GDP: Chapter 02: How it's calculatedSlide 8 of the presentation on GDP: C + I + G + NXSlide 9 of the presentation on GDP: A sense of scaleSlide 10 of the presentation on GDP: Chapter 03: Nominal, real, per capitaSlide 11 of the presentation on GDP: Nominal against realSlide 12 of the presentation on GDP: Who is richer, China or Switzerland?Slide 13 of the presentation on GDP: Chapter 04: Why everyone watches itSlide 14 of the presentation on GDP: When the odometer slows downSlide 15 of the presentation on GDP: GDP grows, not everyone is better off.Slide 16 of the presentation on GDP: Which of these does NOT enter GDP?Slide 17 of the presentation on GDP: And now, the review
    Flash10 slidesThe essential thread, to present in classFull17 slidesEvery chapter and the deeper detail

    Common myths

    • ✗ Myth If GDP grows, everyone is better off.

      ✓ Reality GDP is an average that says nothing about how wealth is distributed: it can grow while part of the country stands still. That's why it's paired with other indicators, from GDP per capita to inequality indexes.

    • ✗ Myth GDP counts everything that gets produced.

      ✓ Reality Unpaid housework and volunteering stay out, because no transaction ever happens. The shadow economy, surprisingly, is in: statistical offices estimate it and include it in national accounts. What GDP can't see is value that never gets a price.

    • ✗ Myth High GDP means a rich country.

      ✓ Reality It depends on how many people share it: China's total GDP dwarfs Switzerland's, but Swiss GDP per capita is several times China's. Size matters; the ratio to population matters more.

    Mind map

    Drag the background to move around and the nodes to reposition them; use − and + to collapse and expand branches.
    Customize
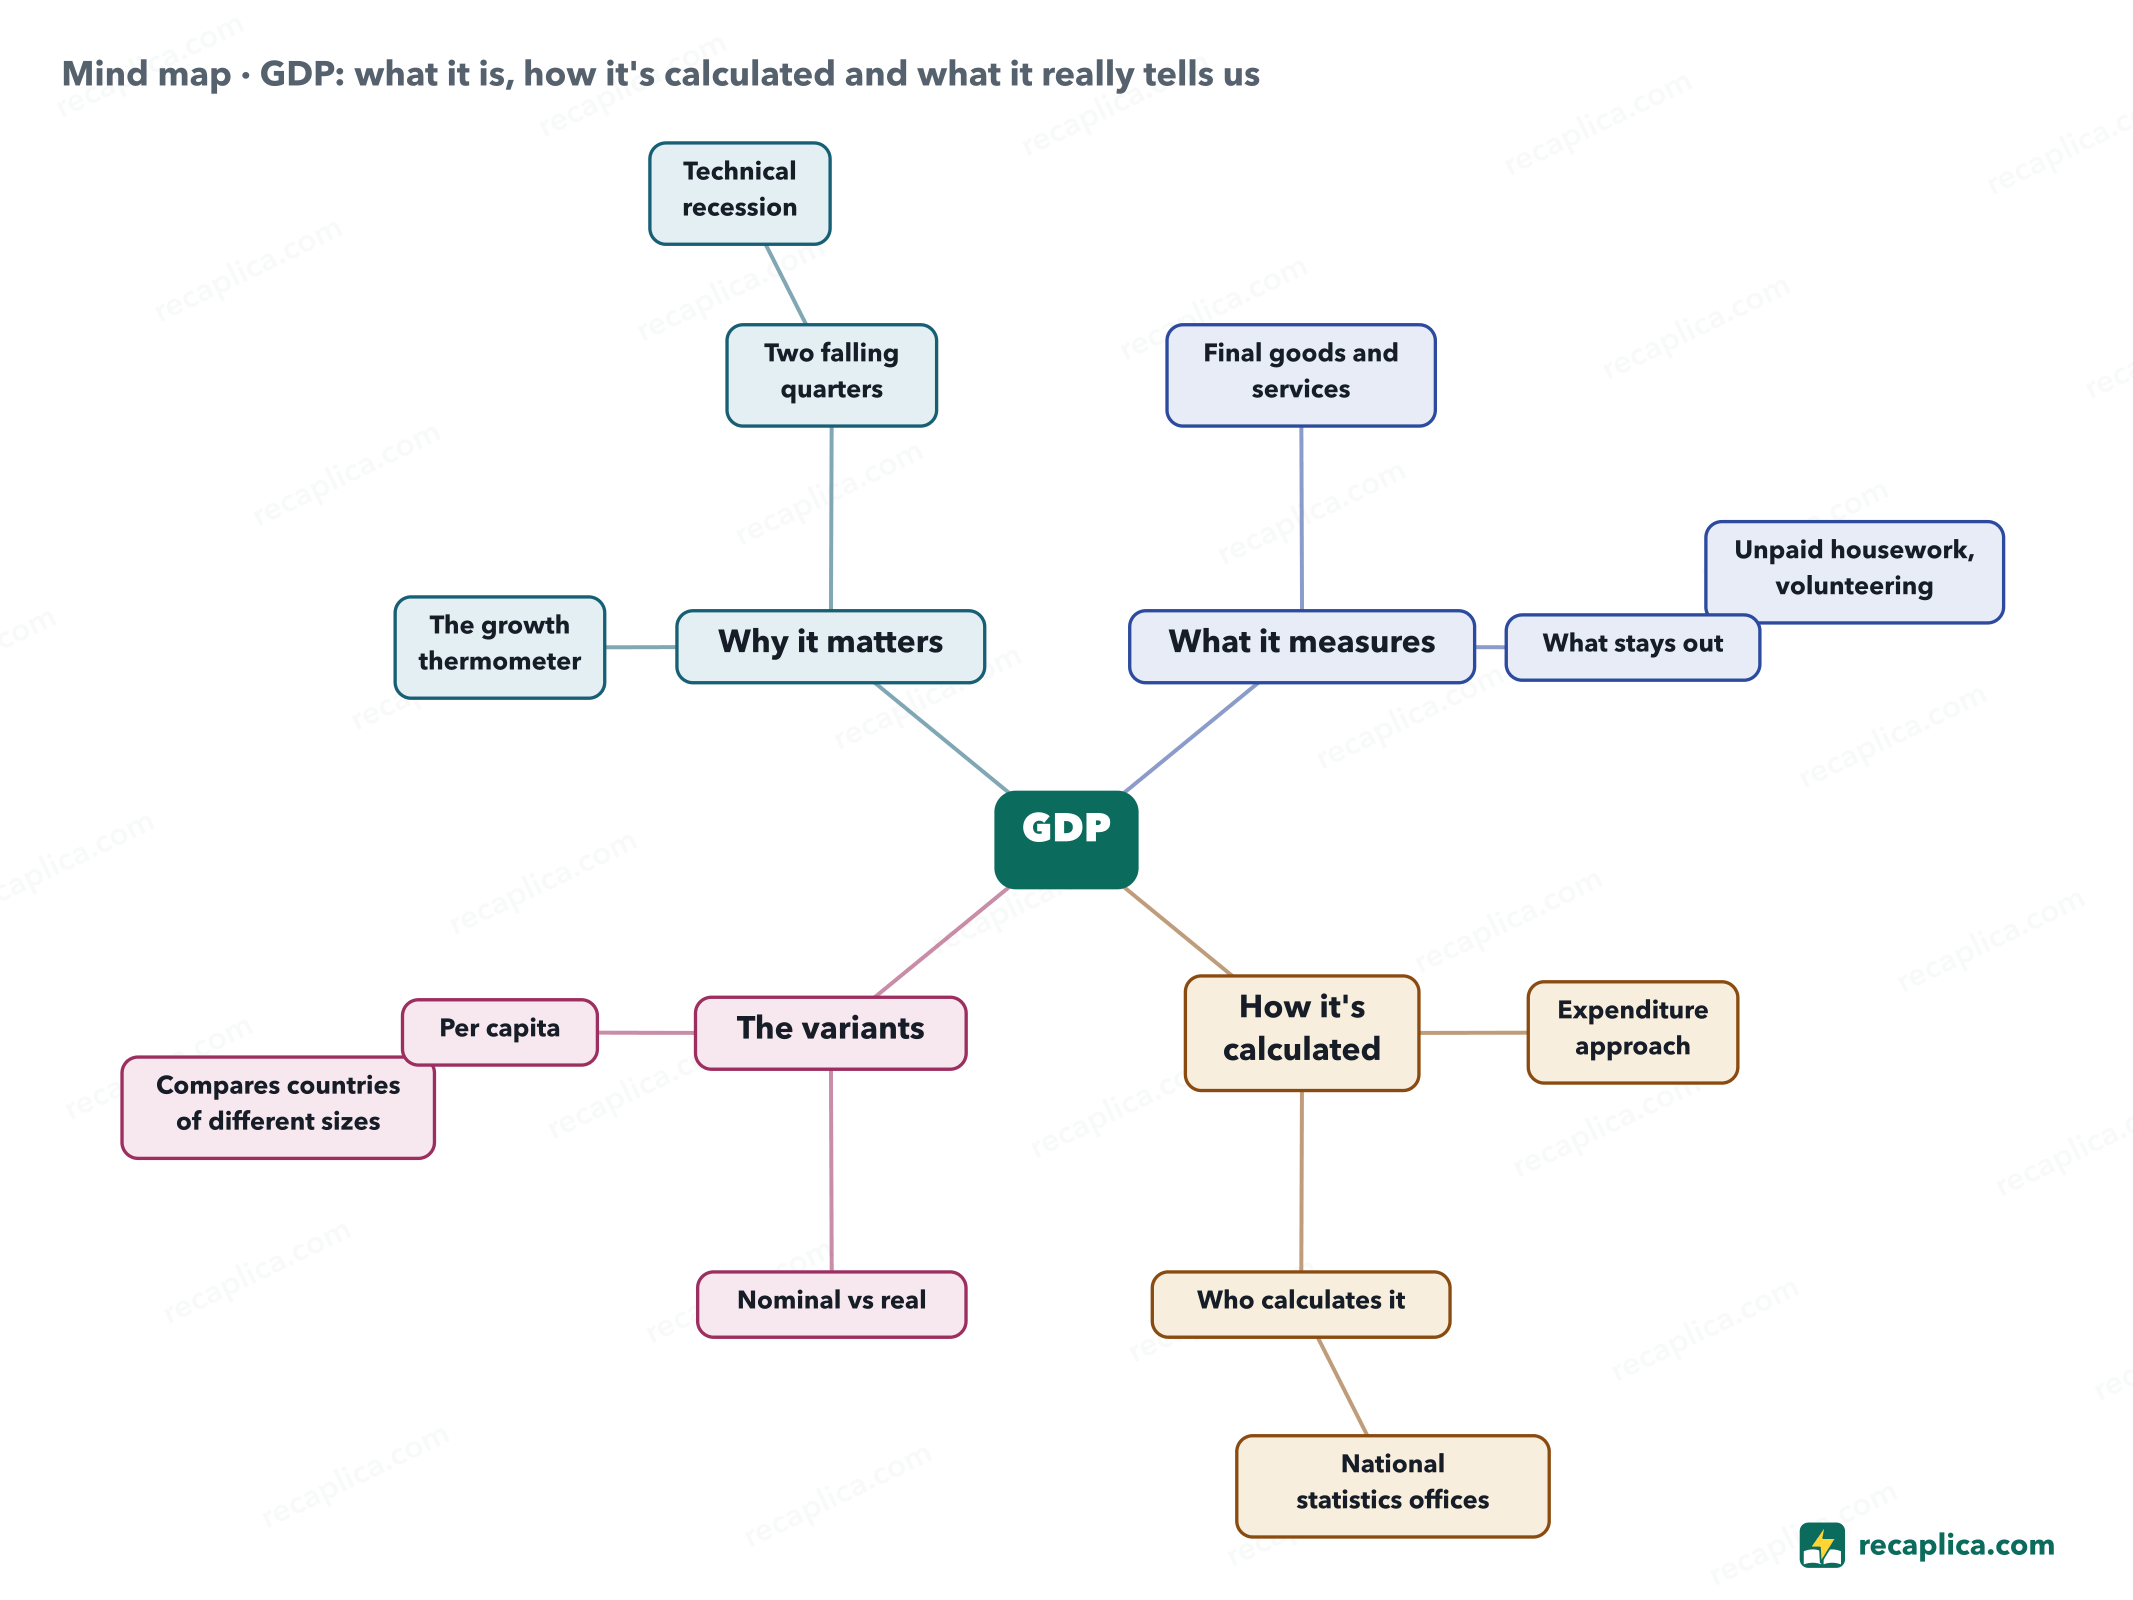
    Mind map: GDP: what it is, how it's calculated and what it really tells us
    • GDP
      • What it measures
        • Final goods and services Produced within the borders, in a period.
        • What stays out
          • Unpaid housework, volunteering
      • How it's calculated
        • Expenditure approach C + I + G + net exports.
        • Who calculates it
          • National statistics offices
      • The variants
        • Nominal vs real Real strips out the effect of inflation.
        • Per capita
          • Compares countries of different sizes
      • Why it matters
        • The growth thermometer
        • Two falling quarters
          • Technical recession

    Quiz: test yourself

    Answer the questions to check what you have learned: you get instant feedback and a short explanation.

    Grade 0/10 0/5
    1 What does GDP measure?

    GDP photographs one period's production (usually a year or a quarter), not wealth accumulated over time: that's a different quantity (national wealth).

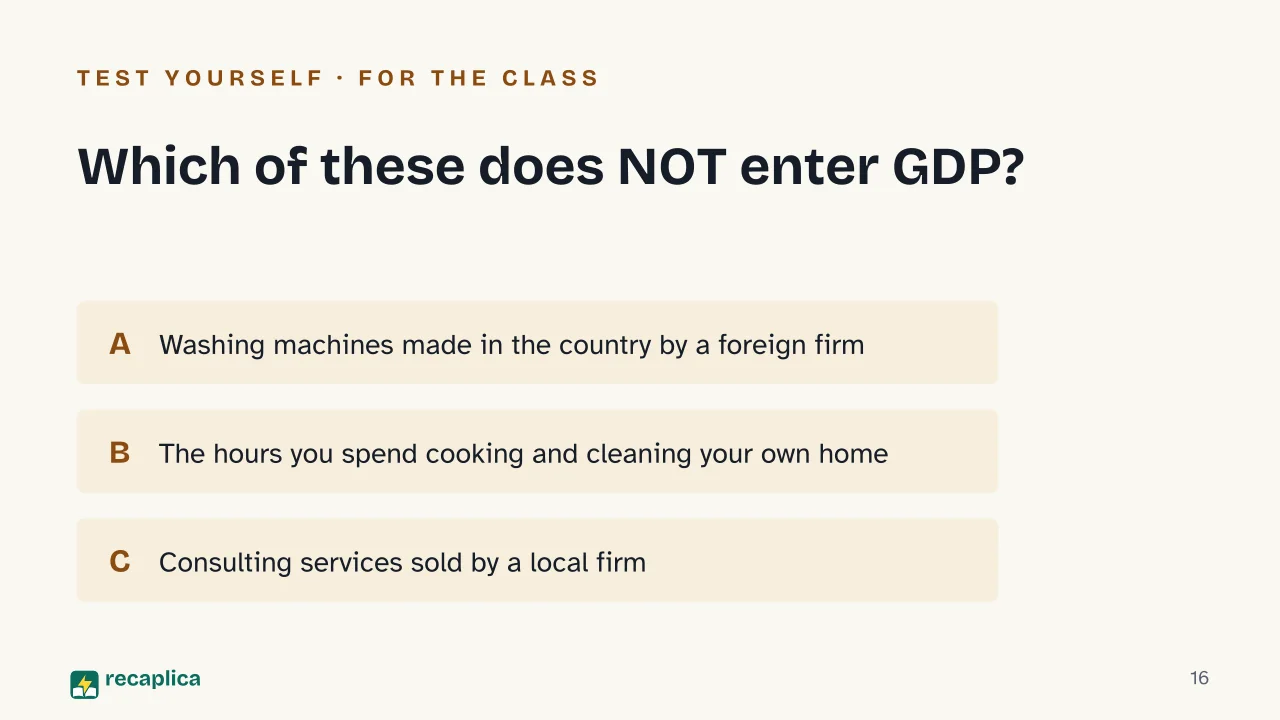
    2 Which of these does NOT enter GDP?

    Housework never passes through the market, so GDP can't see it. The foreign-owned factory does count: what matters is where production happens, not the producer's nationality.

    3 What's the difference between nominal and real GDP?

    If prices rise 5% while production stands still, nominal GDP grows 5% but real GDP is flat. To know whether an economy truly produces more, always look at the real one.

    4 What does the formula C + I + G + NX stand for?

    It's the expenditure approach: add what households spend (C), what firms invest (I), what government spends (G), plus exports minus imports (NX).

    5 True or false: GDP per capita is used to compare countries with different populations.

    Dividing GDP by population gives a comparable measure: it's why a small country can rank 'richer' than an economic giant.

    Answers: 1-A · 2-B · 3-A · 4-A · 5-A

    Flashcards

    Tap the card to flip it and check whether you remember the answer, then move to the next one.

    1 / 6

    Explain it in your own words

    The ultimate test: if you can explain it in simple words, you've truly understood it. Write your explanation, then compare it with the Recap.

    Your explanation is saved only on this device.

    GDP (gross domestic product) is the value of all final goods and services produced in a country over a period. It's the economy's odometer: when it grows, the country is producing and earning more; when it falls for long enough, that's a recession. It doesn't measure everything that matters, though: housework, the environment and wellbeing stay out of the count.

    Frequently asked questions

    Who calculates GDP?

    Each country's national statistics office (ISTAT in Italy, the BEA in the US), following international standards that make figures comparable. Estimates come out quarterly and get revised as more complete data arrives.

    Why 'domestic' and why 'gross'?

    Domestic because it counts what is produced within the country's borders, whoever produces it. Gross because it doesn't subtract the wear and tear of machinery and infrastructure used in production (depreciation).

    Does GDP measure wellbeing?

    Only partially: it says how much gets produced, not how people live. Health, the environment, free time and inequality don't enter the count, which is why complementary indicators exist alongside it.

    What happens when GDP falls?

    One isolated dip can happen; when it lasts at least two consecutive quarters it's called a technical recession. Falling output means lower incomes, fewer hires and less tax revenue, and that's why GDP is watched so closely.

    Sources

    • ISTAT — National accounts, years 2023-2024

    Every Recap goes through an independent review before publication.

    Every evening, the day's new Recaps on our Telegram channel. Join the channel →

    Keep learning

    • Economics Labor Market: How Supply, Demand and Unemployment Work The labor market is where businesses that need workers to produce goods and services meet the people willing to work for them. In the textbook model, that meeting sets wages and employment levels the way any other market would, but imperfect information, bargaining power and legal rules push the real market away from pure competition. Those gaps are where unemployment comes from, and economists split it into frictional, structural, cyclical and technological types depending on the cause. Official statistics, such as Italy's ISTAT, measure it against the labor force — people employed plus people actively looking for work — not the whole population. As of July 2026, Italy's unemployment rate stood at 5.8%, provisional, against 6.4% for the euro area. Read the Recap →
    • Economics Mercantilism: History, Examples, and Definition Mercantilism was the dominant economic doctrine in Western Europe from the 16th to the 18th century: a state grew powerful by selling more abroad than it bought, building up reserves of gold and silver. Britannica Money describes it as "an economic practice by which governments used their economies to augment state power at the expense of other countries." Colonies had one job under this system: supply raw materials to the mother country and buy finished goods back from it, while at home tariffs and monopolies shielded domestic industry. The name itself came later, from the doctrine's most famous critic: Adam Smith made it current in The Wealth of Nations, published in 1776. Read the Recap →
    • Economics Keynesianism explained: the theory born from the Great Depression Keynesianism is the body of economic thinking named after John Maynard Keynes, the British economist who in the 1930s offered a different way of reading a slump. The IMF notes that when the Great Depression hit, the economic theory of the day could neither explain the collapse nor say how to restart production and employment. Keynes put aggregate demand at the centre — the total spending of households, businesses and government — and argued that full employment is a special case rather than something markets deliver on their own. That is where the idea comes from that public spending can step in when private demand stalls. Keynesianism guided economic policy from the end of the Second World War until the 1970s, then lost ground. Read the Recap →

    recaplica

    Clear in 30 seconds, yours in 10 minutes.

    Recaps Mind maps Request a Recap Telegram channel Mind map maker Our method About Privacy & cookies Legal notes & terms of use

    © 2026 Recaplica · A project by Curi S.r.l. — VAT IT05472000750

    Statistics, only if you say so

    To learn which Recaps help most we would use Google Analytics, with aggregate, anonymous data. It starts only with your OK, and you can change your mind anytime. Privacy policy