Skip to content
recaplica

    One moment: security check

    Cloudflare wants to make sure you're not a robot. Tick the box below and your search will continue on its own.

    IT
    recaplica Nuclear Power Plant: How It Works
    © 2026 Recaplica · recaplica.com — All rights reserved
    Home › Technology

    Nuclear Power Plant: How It Works

    By Recaplica Newsroom · Updated on September 30, 2026

    What to print

    Page numbers appear when printing with default margins.

    Slides

    Choose a cut

    Flash10 slidesThe essential thread, to present in classFull16 slidesEvery chapter and the deeper detail

    Both come with speaker notes.

    Telegram channel
    recaplica Clear in 30 seconds, yours in 10 minutes.
    In 30 seconds Key points Figures Deep dive Slides Myths Mind map Quiz Flashcards FAQ

    In 30 seconds quick read

    A nuclear power plant generates electricity from the heat released inside a reactor core. In a pressurized water reactor, water in the primary loop carries that heat to a steam generator, which feeds the turbine connected to the electric generator. Spent fuel stays stored at the plant itself, because no permanent disposal repository has been built yet, according to the U.S. Nuclear Regulatory Commission. World Health Organization data describe two accidents with very different health outcomes: at Chernobyl, in 1986, the WHO recorded 28 deaths among emergency workers within three months, while the more than 6,000 thyroid cancer cases diagnosed by 2005 remain a separate measure of disease incidence, distinct from the death toll. At Fukushima, in 2011, the WHO found no acute radiation deaths at all. In Our World in Data's comparison across energy sources, coal ranks as the deadliest source per terawatt-hour produced, with nuclear, wind and solar all far lower.

    Key Points

    • The primary loop's pressurized water picks up heat from the reactor core and delivers it to the steam generator, which in turn feeds the turbine connected to the electric generator.
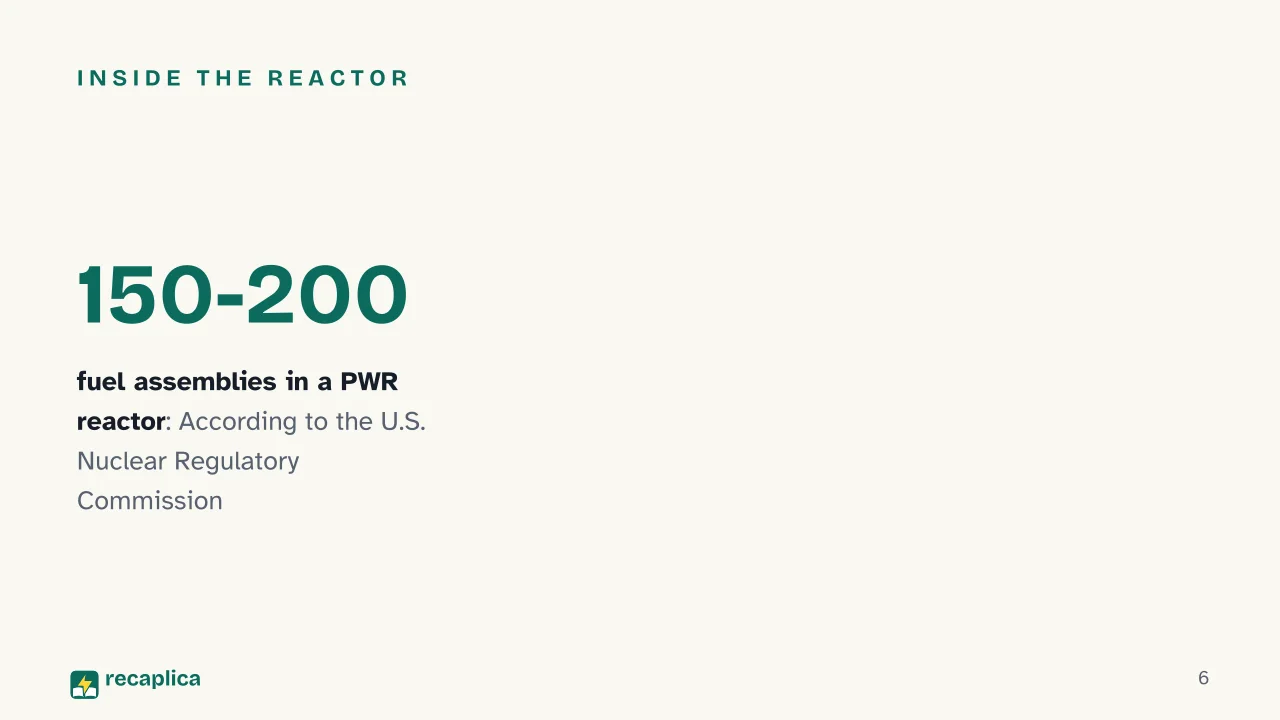
    • A pressurized water reactor typically holds between 150 and 200 fuel assemblies, according to the U.S. Nuclear Regulatory Commission.
    • Until a permanent repository is built, spent fuel stays stored at the plant; high-level waste only stops being dangerous after a decay process that takes hundreds of thousands of years.
    • The WHO recorded 28 direct deaths among Chernobyl emergency workers within three months of the 1986 accident; the more than 6,000 thyroid cancer cases diagnosed in the same area by 2005 are instead a measure of disease incidence.
    • At Fukushima, in 2011, the WHO recorded no acute radiation deaths among plant workers or the public; for a group of about 160 workers who received doses above 100 mSv, it still estimates a higher long-term cancer risk.
    • In Our World in Data's death-rate comparison per TWh produced, coal ranks first among the riskiest sources, while nuclear, wind and solar sit at the lowest levels.

    Key figures

    • 28 Direct deaths recorded by the WHO among emergency workers in the three months after the 1986 Chernobyl accident: a confirmed count from the source, separate from the disease diagnoses recorded in later years. Source: World Health Organization (WHO)
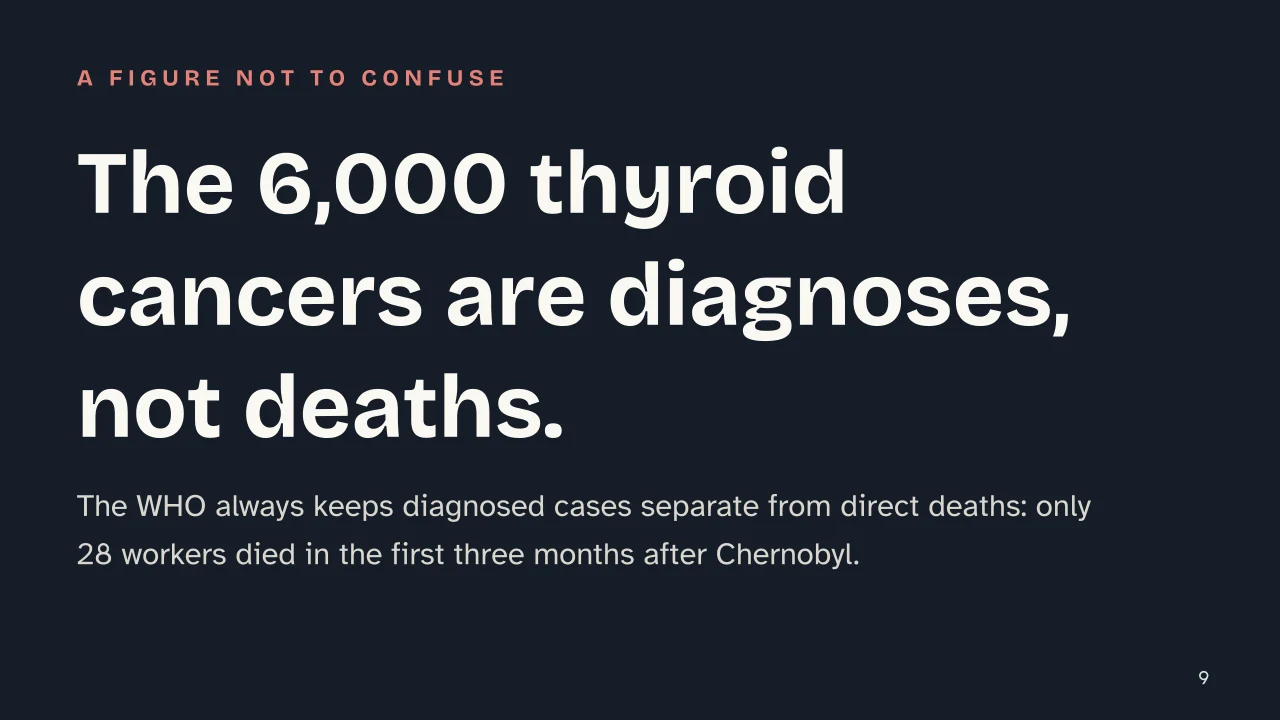
    • 6,000 Thyroid cancer cases diagnosed by 2005 among those exposed as minors in Chernobyl's contaminated areas: a measure of disease incidence, separate from the direct death count. Source: World Health Organization (WHO)
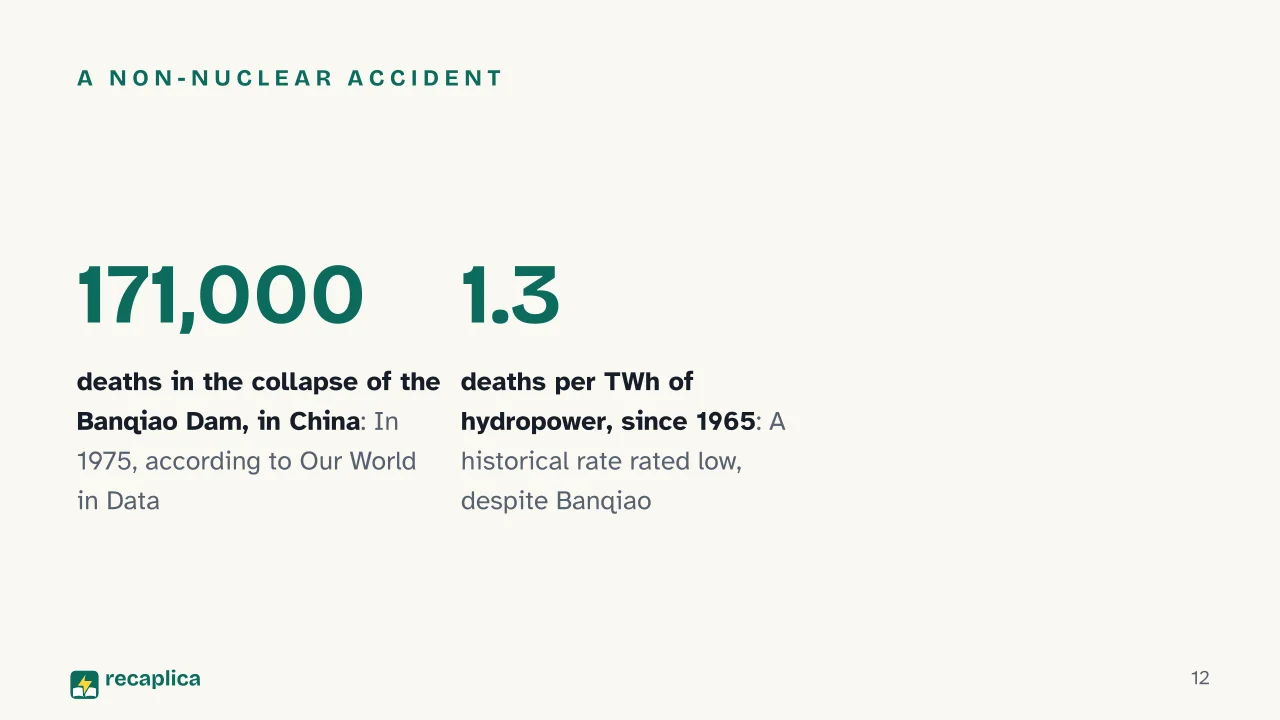
    • 1.3 Deaths per TWh of hydropower produced, calculated since 1965: includes the collapse of the Banqiao Dam, in China, in 1975. Source: Our World in Data (Hannah Ritchie)

    Deep Dive

    How a nuclear power plant works

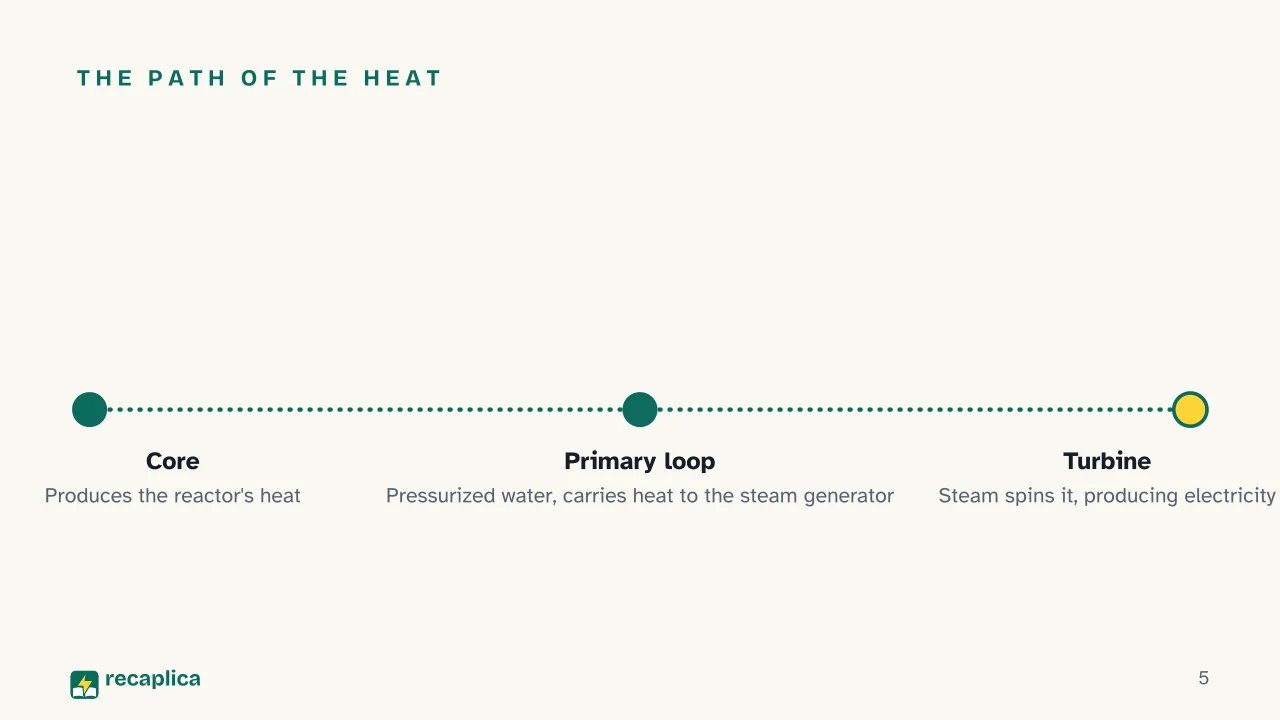
    A nuclear power plant turns the thermal energy released by fission inside a reactor’s core into electricity. In pressurized water reactors, the type the U.S. Nuclear Regulatory Commission describes in detail, a first loop of water held under pressure absorbs that heat and passes it, inside a steam generator, to a second loop; electric pumps keep both loops circulating. The resulting steam pushes the turbine’s blades, and the turbine drives a generator that converts that motion into electric current. A reactor of this kind typically holds between 150 and 200 fuel assemblies, according to the same source.

    Available sources describe the pressurized water design in detail; other reactor configurations exist, but they fall outside this comparison.

    Practical example: picture two separate water loops, one nested inside the other. The first, attached to the core, runs in a closed circuit and passes its heat to the second loop through the steam generator, like a kettle heating the water in a pot set on top of it without the two ever mixing. It’s the second loop, the one carrying steam, that spins the turbine.

    The fission process heating the core is the same physical principle behind the atomic bomb, even though the goal is the opposite: inside a plant the reaction is slowed and controlled to produce heat continuously, while inside a weapon it’s released all at once.

    Waste, a problem that outlasts the plant

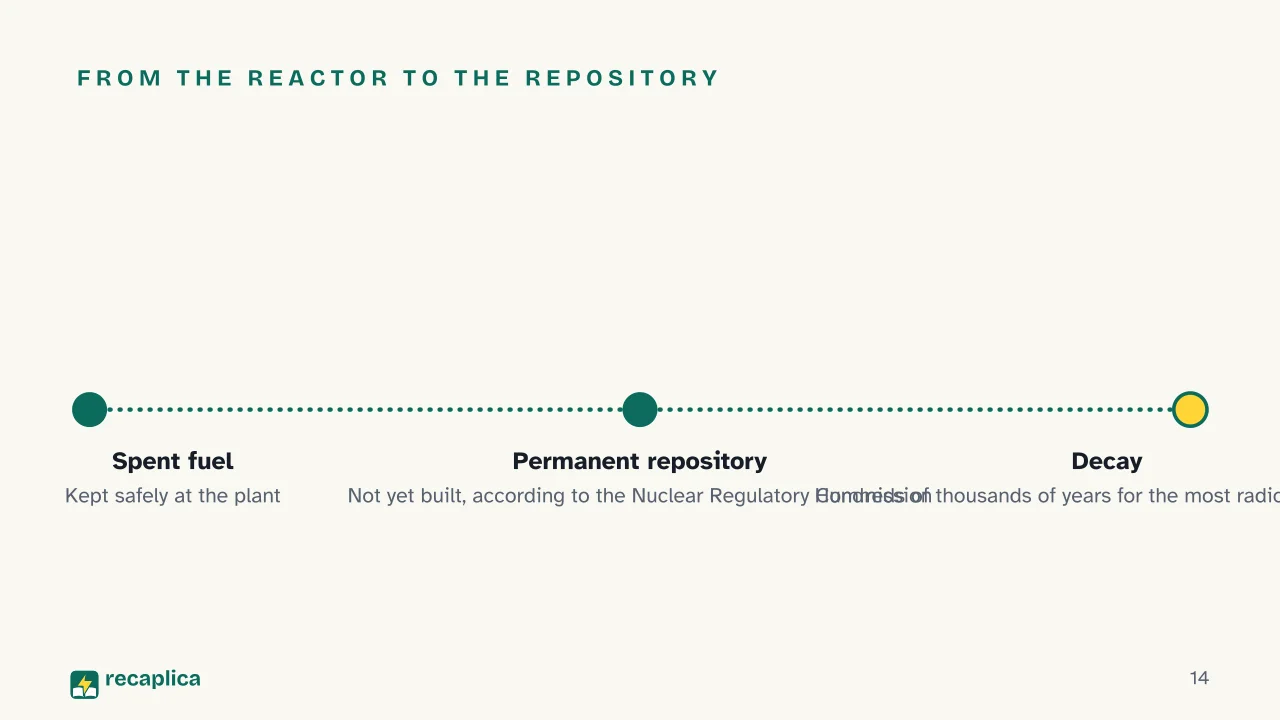
    Fuel that has exhausted its useful charge stays radioactive for a very long time. The Nuclear Regulatory Commission explains that no permanent disposal site exists yet, so plants have to store spent fuel safely on their own. Radioactive decay, the only process that eventually renders this waste harmless, takes an enormous span of time for high-level materials: hundreds of thousands of years, the Nuclear Regulatory Commission notes.

    That extremely long timescale marks a sharp difference from other energy sources, including solar panel systems, where end-of-life mostly means recycling the panels, a material that stops posing the same risks fairly quickly.

    Chernobyl and Fukushima: what the data actually show

    Public perception of nuclear risk has formed largely around two accidents, both rated at the top of the INES scale, level 7: Chernobyl, in Ukraine, in 1986, and Fukushima, in Japan, in 2011. Data collected by the World Health Organization tell two very different health stories.

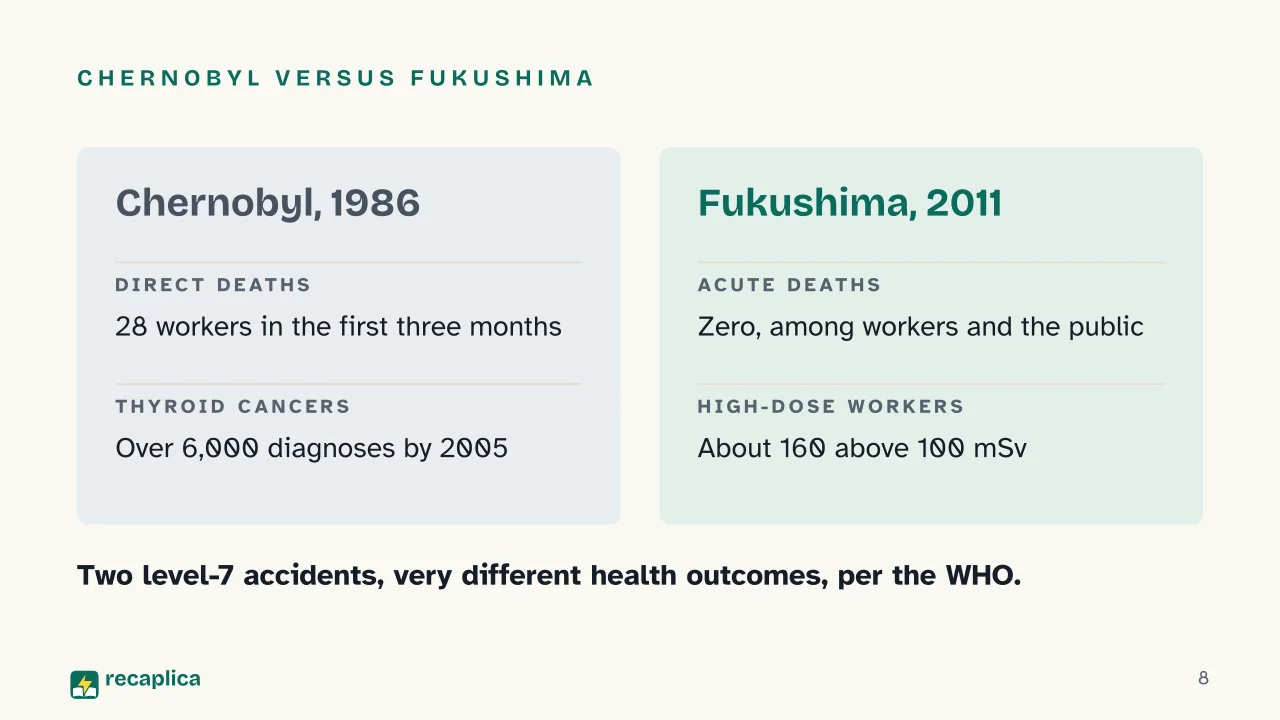
    At Chernobyl, the WHO counted 28 direct deaths among emergency workers, firefighters and plant staff, in the three months after the accident: a confirmed count from the source. The 6,000 thyroid cancer cases diagnosed by 2005, affecting people who were still minors and living in the fallout zone back in 1986, are a different matter: the WHO considers a large share of them attributable to radioactive iodine intake, but they remain diagnoses accumulated over time, a measure of how many people fell ill, not a death count. For the general exposed population, excluding the thyroid, the WHO finds no clearly demonstrated increase in solid cancers or leukemia. Among roughly 530,000 clean-up workers, the so-called liquidators, the average estimated dose was 120 mSv; only among those who received doses above 200 mSv does some evidence of a rise in leukemia incidence emerge.

    At Fukushima the picture changes. Estimated lifetime effective doses for adult residents of the prefecture averaged around 10 mSv or less, roughly double that for one-year-old infants; plant workers received an average of about 12 mSv over the first 19 months after the accident, with 35% of the workforce above 10 mSv and 0.7% above 100 mSv. The WHO records no acute injuries and no acute deaths linked to radiation, a finding that covers both plant staff and the resident population. For a group of about 160 workers who received doses above 100 mSv, the WHO still estimates a higher cancer risk over time; for the general population, aside from the thyroid, estimated cancer risks remain small next to the baseline risk. On children’s thyroids the WHO flags a specific uncertainty, because doses are hard to verify through direct measurement; it also notes that very sensitive screening itself tends to pick up more cysts, nodules and cancers than would have surfaced without such intensive monitoring.

    Nuclear power compared with other energy sources

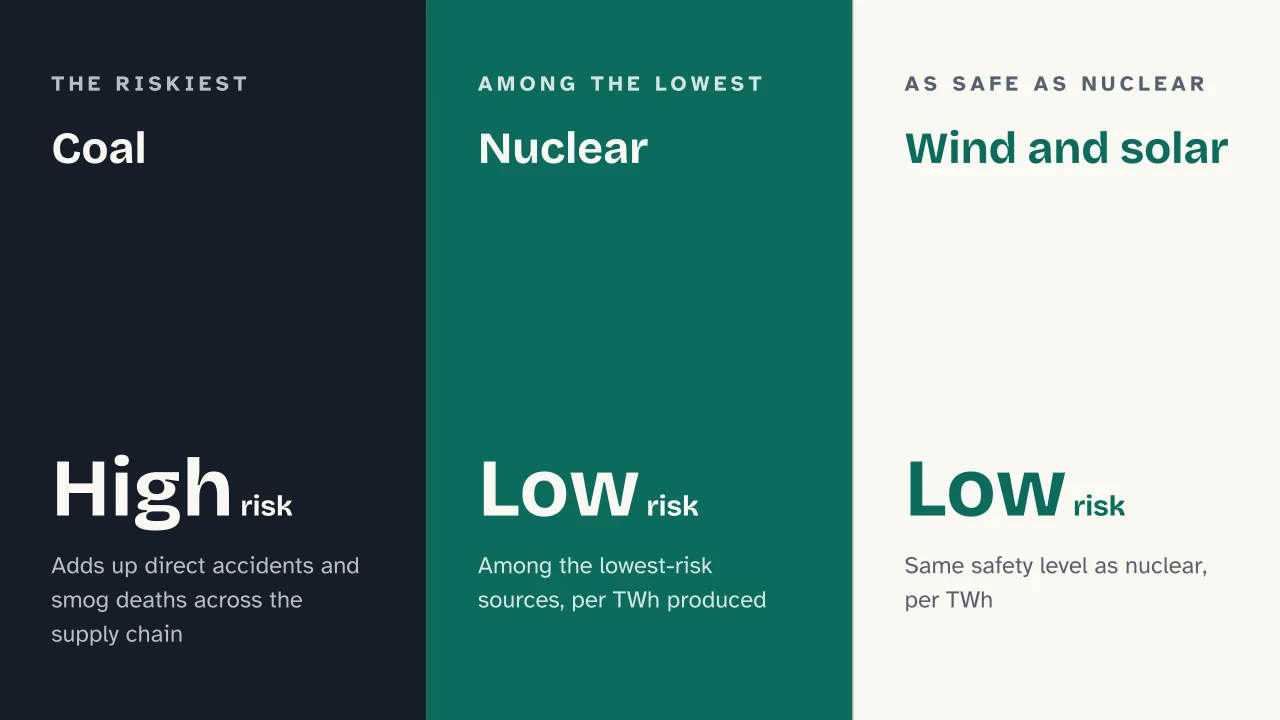
    Making sense of these numbers takes a benchmark. Our World in Data, in an analysis by researcher Hannah Ritchie, compares energy sources by deaths per TWh of electricity produced, a calculation that adds up direct accidents and the deaths from air pollution inhaled across the entire supply chain. In this comparison coal comes out, in the source’s own words, as “by far” the most dangerous; wind and solar turn out to be “just as safe” as nuclear.

    Source / eventFigureYear
    Banqiao Dam (China), collapseabout 171,000 deaths in a single disaster1975
    Hydropower, historical rate1.3 deaths per TWh producedsince 1965
    Chernobyl, direct deaths28 workers in the first three months1986
    Fukushima, acute radiation deathszero, among workers and the public2011

    The hydropower figure helps put the fear of nuclear power in perspective: the Banqiao Dam collapse, in 1975, killed more people on its own than any civilian nuclear accident on record, and yet hydropower’s historical death rate is still considered low. For nuclear power, some comparative studies cite higher mortality figures: to calculate its own rate, Our World in Data uses a total of 433 deaths for Chernobyl — an assumption within the estimated range for that accident — and 2,314 for Fukushima. That second figure sums two official counts from the Japanese government: 2,313 deaths certified as disaster-related, for the stress and disruption of the forced evacuation (a figure revised in September 2020), and one death from lung cancer recognized in 2018 as caused by radiation exposure — against the zero acute radiation deaths the WHO recorded.

    The comparison across energy sources also connects to other questions around the energy transition, such as the availability of critical minerals needed by both nuclear power and renewables, and to the climate effects described in the greenhouse effect article, topics that fall outside the scope of the health data discussed here, which are limited to direct and estimated mortality by energy source.

    Slide deck

    Slides ready to download and make your own in PowerPoint or Google Slides, with speaker notes. Pick the Flash cut or the Full one.
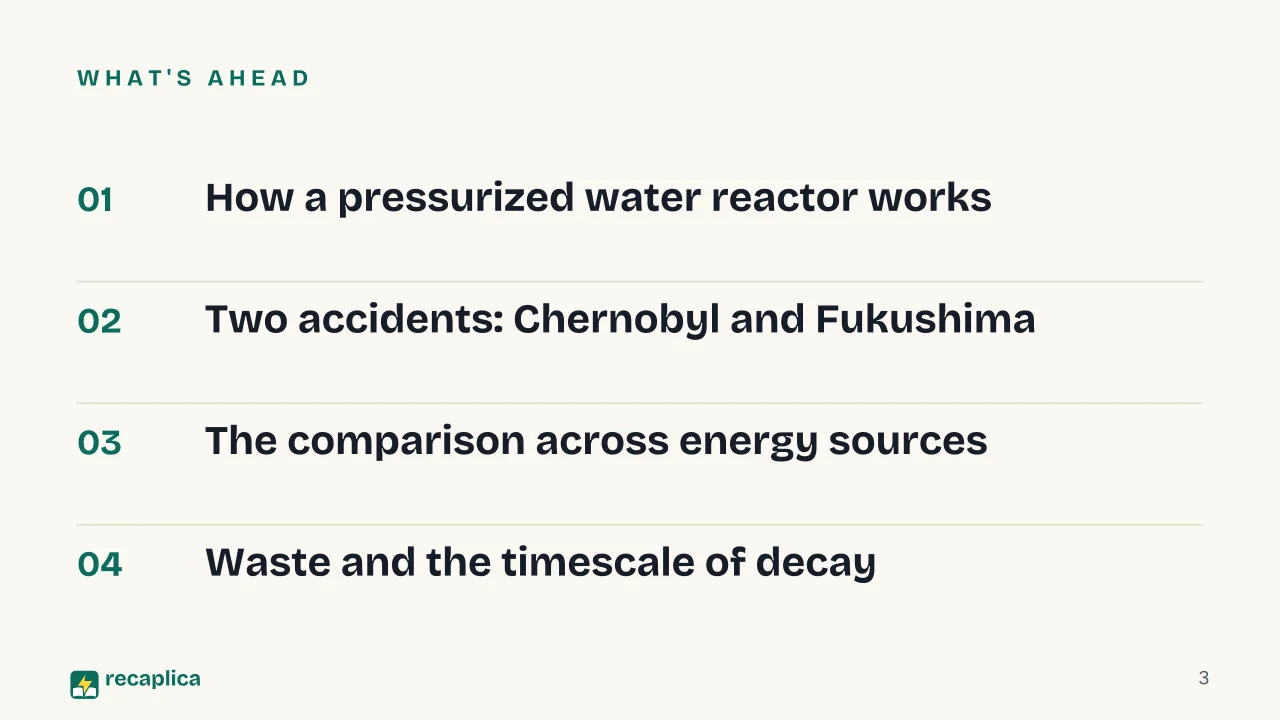
    Slide 1 of the presentation on Nuclear Power Plant: Nuclear Power Plant, How It WorksSlide 2 of the presentation on Nuclear Power Plant: How dangerous is a nuclear power plant, really?Slide 3 of the presentation on Nuclear Power Plant: What's aheadSlide 4 of the presentation on Nuclear Power Plant: Chapter 01: How it worksSlide 5 of the presentation on Nuclear Power Plant: The path of the heatSlide 6 of the presentation on Nuclear Power Plant: Inside the reactorSlide 7 of the presentation on Nuclear Power Plant: Chapter 02: Two accidents, two outcomesSlide 8 of the presentation on Nuclear Power Plant: Chernobyl versus FukushimaSlide 9 of the presentation on Nuclear Power Plant: The 6,000 thyroid cancers are diagnoses, not deaths.Slide 10 of the presentation on Nuclear Power Plant: Chapter 03: Perception versus dataSlide 11 of the presentation on Nuclear Power Plant: Coal · Nuclear · Wind and solarSlide 12 of the presentation on Nuclear Power Plant: A non-nuclear accidentSlide 13 of the presentation on Nuclear Power Plant: Chapter 04: Waste, a matter of timeSlide 14 of the presentation on Nuclear Power Plant: From the reactor to the repositorySlide 15 of the presentation on Nuclear Power Plant: How many workers died in the first three months after Chernobyl, according to the WHO?Slide 16 of the presentation on Nuclear Power Plant: To learn more
    Flash10 slidesThe essential thread, to present in classFull16 slidesEvery chapter and the deeper detail

    Common myths

    • ✗ Myth Nuclear accidents have caused tens of thousands of deaths from radiation.

      ✓ Reality The WHO recorded 28 direct deaths among Chernobyl emergency workers in the three months after the 1986 accident, and no acute radiation deaths at all at Fukushima, in 2011, among either workers or the public. The 6,000 thyroid cancer cases diagnosed by 2005 are disease diagnoses, a measure of incidence distinct from the death count. Higher figures that circulate in some energy comparisons, such as the 2,314 deaths Our World in Data attributes to Fukushima, are certified by the Japanese government in two separate parts: most tied to the hardship of forced displacement, a count last updated in September 2020, plus a single lung-cancer death the government recognized in 2018 as caused by radiation exposure.

    • ✗ Myth Nuclear is the most dangerous energy source there is.

      ✓ Reality In Our World in Data's comparison per TWh produced, coal comes out as the riskiest by a wide margin, partly because of deaths linked to smog inhaled across its entire supply chain; nuclear, wind and solar occupy the opposite end of that same ranking. Even hydropower, with a historical rate of 1.3 deaths per TWh since 1965, has the worst single energy disaster on record behind it: the collapse of the Banqiao Dam, in China, in 1975, which killed roughly 171,000 people.

    • ✗ Myth Nuclear waste can be disposed of quickly, or soon stops being dangerous.

      ✓ Reality According to the U.S. Nuclear Regulatory Commission, high-level waste becomes harmless only through natural radioactive decay, a process that takes hundreds of thousands of years. Until a permanent disposal repository is built, spent fuel stays safely stored directly at the plants.

    Mind map

    Drag the background to move around and the nodes to reposition them; use − and + to collapse and expand branches.
    Customize
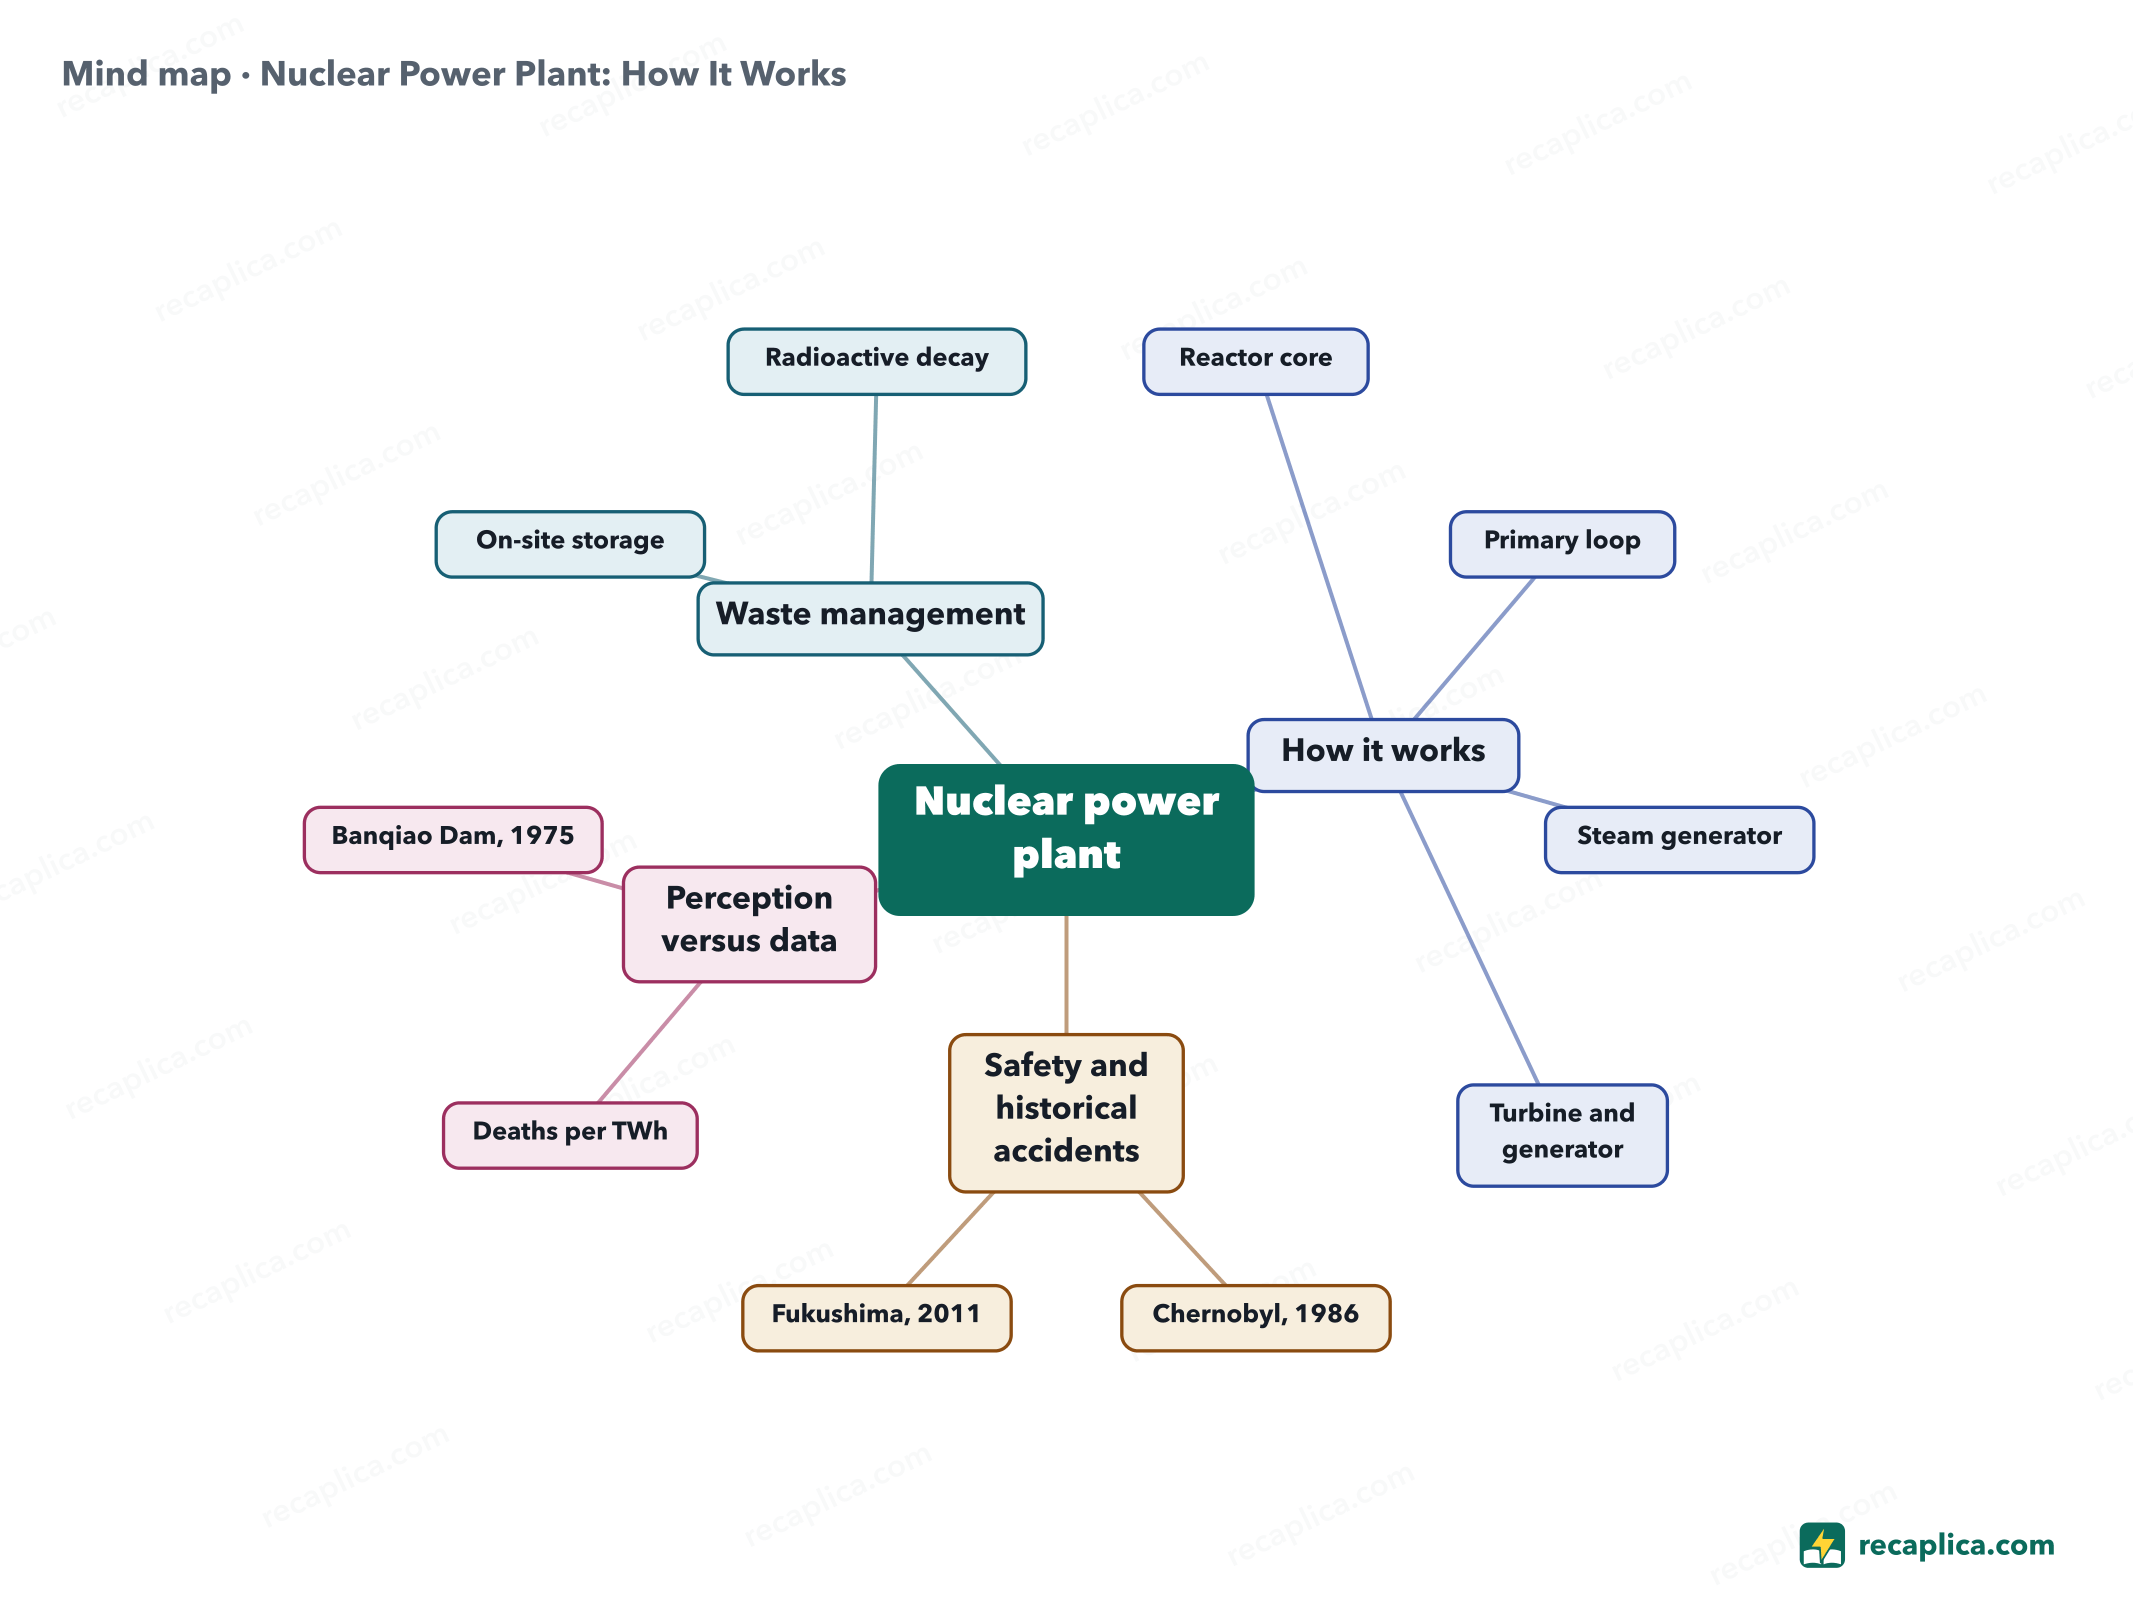
    Mind map: Nuclear Power Plant: How It Works
    • Nuclear power plant
      • How it works
        • Reactor core Produces heat, in a pressurized water reactor with 150 to 200 fuel assemblies
        • Primary loop Pressurized water, moved by electric pumps, carries the heat to the steam generator
        • Steam generator Heat from the primary loop turns the water of a second loop into steam
        • Turbine and generator Steam spins the turbine, which drives the generator that produces the plant's electricity
      • Safety and historical accidents
        • Chernobyl, 1986 28 direct deaths in the following three months, over 6,000 thyroid cancer diagnoses by 2005
        • Fukushima, 2011 No acute radiation deaths for workers or the public, according to the WHO
      • Perception versus data
        • Deaths per TWh Coal tops the risk ranking, nuclear and wind at the lowest levels, according to Our World in Data
        • Banqiao Dam, 1975 About 171,000 deaths, the worst energy disaster on record
      • Waste management
        • On-site storage While awaiting a permanent repository, according to the Nuclear Regulatory Commission
        • Radioactive decay High-level waste stays dangerous for a time measured in hundreds of thousands of years

    Quiz: test yourself

    Answer the questions to check what you have learned: you get instant feedback and a short explanation.

    Grade 0/10 0/5
    1 How does a pressurized water reactor (PWR) generate electricity?

    Heat produced in the core passes into the primary loop's water; inside the steam generator, that heat warms a second loop, and the resulting steam sets the turbine in motion, driving the electric generator, according to the U.S. Nuclear Regulatory Commission.

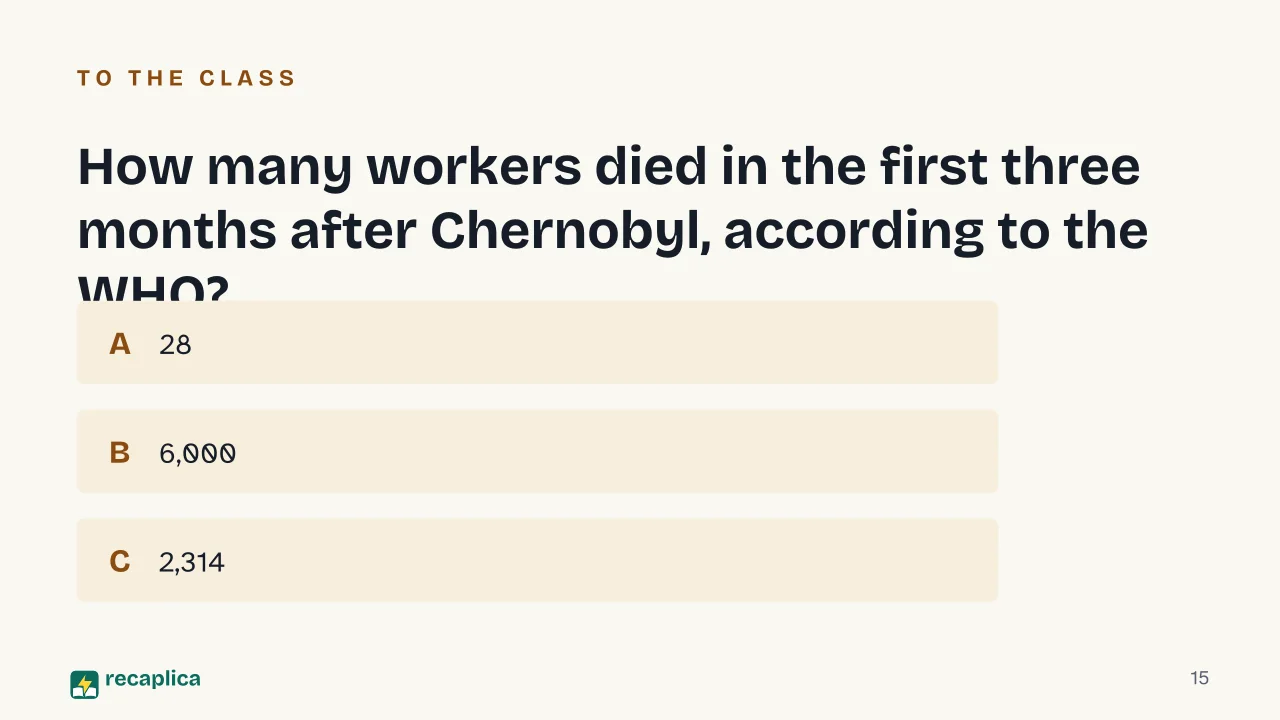
    2 How many workers died in the first three months after the 1986 Chernobyl accident, according to the WHO?

    The World Health Organization records 28 confirmed deaths among emergency workers exposed to acute doses in the three months after the 1986 accident. The 6,000 figure covers thyroid cancer diagnoses accumulated by 2005, a measure of incidence distinct from deaths; 433 is the value Our World in Data assumes within the estimated range for Chernobyl, while 2,314 for Fukushima mostly reflects the toll of the evacuation, with a single radiation-linked cancer case, unlike the WHO's direct count.

    3 How many acute radiation deaths were recorded among workers and the public in the 2011 Fukushima accident, according to the WHO?

    No acute radiation deaths are recorded by the WHO, either among plant staff or area residents. A group of about 160 workers who received very high doses does show a higher estimated cancer risk over time, according to the WHO.

    4 What do the 6,000 thyroid cancer cases linked to Chernobyl, diagnosed by 2005, represent?

    The WHO counts these cases as disease diagnoses among those who were still minors when the 1986 accident contaminated their area: a measure of incidence, separate from the number of direct deaths, which stands at 28 according to the same agency.

    5 According to Our World in Data, which energy source is by far the most dangerous per TWh produced?

    Our World in Data's calculation adds up direct accidents and the deaths linked to air pollution produced across coal's entire supply chain, making it the riskiest in the whole comparison; nuclear, wind and solar remain at the lowest levels.

    Answers: 1-A · 2-A · 3-A · 4-B · 5-B

    Flashcards

    Tap the card to flip it and check whether you remember the answer, then move to the next one.

    1 / 8

    Explain it in your own words

    The ultimate test: if you can explain it in simple words, you've truly understood it. Write your explanation, then compare it with the Recap.

    Your explanation is saved only on this device.

    A nuclear power plant generates electricity from the heat released inside a reactor core. In a pressurized water reactor, water in the primary loop carries that heat to a steam generator, which feeds the turbine connected to the electric generator. Spent fuel stays stored at the plant itself, because no permanent disposal repository has been built yet, according to the U.S. Nuclear Regulatory Commission. World Health Organization data describe two accidents with very different health outcomes: at Chernobyl, in 1986, the WHO recorded 28 deaths among emergency workers within three months, while the more than 6,000 thyroid cancer cases diagnosed by 2005 remain a separate measure of disease incidence, distinct from the death toll. At Fukushima, in 2011, the WHO found no acute radiation deaths at all. In Our World in Data's comparison across energy sources, coal ranks as the deadliest source per terawatt-hour produced, with nuclear, wind and solar all far lower.

    Frequently asked questions

    What is a nuclear power plant?

    It's a facility that generates electricity from the heat released by fission inside a reactor: in pressurized water models, water in the primary loop transfers that heat to a steam generator, whose steam drives the turbine connected to the generator.

    How many people died from the radiation at Chernobyl and Fukushima?

    The WHO's direct count records 28 deaths among firefighters and plant staff at Chernobyl, who died within three months of the 1986 accident; at Fukushima, in 2011, the WHO records no acute radiation deaths among workers or the public. The 6,000 thyroid cancer cases diagnosed by 2005 are disease diagnoses, a figure separate from the death count, and higher numbers used in some energy comparisons (such as Our World in Data's 2,314 for Fukushima) combine two official Japanese government counts: the bulk from the hardship of evacuation, plus a single case the government attributed to radiation exposure in 2018 — not the same measure as the WHO's direct count of acute deaths.

    Does nuclear waste stay dangerous forever?

    The U.S. Nuclear Regulatory Commission explains that this waste stops being a threat only through the natural radioactive decay of the material, a process measured in hundreds of thousands of years. Spent fuel is kept at the plants themselves while a permanent disposal repository is built.

    Is nuclear power more dangerous than coal or renewables?

    Our World in Data says no: in its risk ranking per TWh produced, coal takes the top spot, and both nuclear and the leading renewables land far below it.

    What are the pros and cons of a nuclear power plant?

    On the plus side, its death rate per TWh produced ranks among the lowest in Our World in Data's comparison across energy sources. On the downside, managing waste requires storage and monitoring over extremely long timeframes, and public perception of the risk remains shaped by accidents such as Chernobyl and Fukushima.

    Sources

    • U.S. Nuclear Regulatory Commission, "Pressurized Water Reactors"
    • U.S. Nuclear Regulatory Commission, "High-Level Waste"
    • World Health Organization, "Radiation: The Chernobyl accident"
    • World Health Organization, "Health consequences of Fukushima nuclear accident"
    • Our World in Data, "What are the safest and cleanest sources of energy?" (Hannah Ritchie)
    • Our World in Data, "What was the death toll from Chernobyl and Fukushima?" (Hannah Ritchie)

    Every Recap goes through an independent review before publication.

    Every evening, the day's new Recaps on our Telegram channel. Join the channel →

    Keep learning

    • Technology OOP: What Is Object-Oriented Programming Object-oriented programming, or OOP, builds software around objects that bundle data and the functions that act on it, instead of keeping the two apart. Every object comes from a class, the blueprint that fixes its state and behavior, the same way one bicycle model fixes what every bike built from it can do. Documentation across languages keeps circling back to four recurring ideas — encapsulation, inheritance, polymorphism, and abstraction — though not every source tells the story the same way. Java, Python, and C++ each implement OOP with their own mechanics, and none of the sources treats it as the only way to write software. Read the Recap →
    • Technology DBMS: What It Is, the Main Types, and Real Examples A DBMS, short for database management system, is the software that lets people create, query and update the data in a database without having to know how that data is physically stored. Compared with spreadsheets or scattered files, it keeps data in one place and more consistent, cutting down on duplication and security gaps. The most common type is the relational model, which organizes data into linked tables and is queried with SQL. Nonrelational, or NoSQL, systems handle more flexible data, and two older models, hierarchical and network, sit alongside an object-oriented model. Read the Recap →
    • Technology ER Diagram (Entity-Relationship Diagram): What It Is and How to Build One An entity-relationship diagram, or ER diagram, is the map database designers draw before building a database: it shows which objects need tracking (entities), what information describes them (attributes) and how they connect to each other (relationships). It's a conceptual design step, not the finished database schema — the translation into real tables comes later. The two most common notations are Chen, which uses rectangles and ovals, and Crow's Foot, which uses lines ending in circles, bars and crow's feet to show how many instances connect. A relationship can be one-to-one, one-to-many or many-to-many, and each type has its own way of being drawn. Read the Recap →

    recaplica

    Clear in 30 seconds, yours in 10 minutes.

    Recaps Mind maps Request a Recap Telegram channel Mind map maker Our method About Privacy & cookies Legal notes & terms of use

    © 2026 Recaplica · A project by Curi S.r.l. — VAT IT05472000750

    Statistics, only if you say so

    To learn which Recaps help most we would use Google Analytics, with aggregate, anonymous data. It starts only with your OK, and you can change your mind anytime. Privacy policy