Skip to content
recaplica

    One moment: security check

    Cloudflare wants to make sure you're not a robot. Tick the box below and your search will continue on its own.

    IT
    recaplica Richest Countries in the World: Total GDP vs. GDP per Capita Compared
    © 2026 Recaplica · recaplica.com — All rights reserved
    Home › Economics

    Richest Countries in the World: Total GDP vs. GDP per Capita Compared

    By Recaplica Newsroom · Updated on October 1, 2026

    What to print

    Page numbers appear when printing with default margins.

    Slides

    Choose a cut

    Flash10 slidesThe essential thread, to present in classFull15 slidesEvery chapter and the deeper detail

    Both come with speaker notes.

    Telegram channel
    recaplica Clear in 30 seconds, yours in 10 minutes.
    In 30 seconds Key points Figures Deep dive Slides Myths Mind map Quiz Flashcards FAQ

    In 30 seconds quick read

    The list of richest countries in the world depends on what you measure. By total GDP, the size of a country's whole economy, the United States led in 2025 with China second, according to the World Bank. GDP per capita tells a different story: in 2025 Luxembourg and Ireland had the highest index in the European Union, according to Eurostat, even though Luxembourg ranked only 75th worldwide for total GDP. The World Bank also tracks gross national income per capita, a separate measure from GDP, using two methods that produce different results: Singapore led in 2025 at purchasing power parity, while Bermuda came first under the Atlas method. There is no single answer to which country is richest, because it depends on the measure and the method chosen.

    Key Points

    • By total GDP, the size of the whole economy, the United States was the richest country in the world in 2025, followed by China, according to the World Bank.
    • By GDP per capita, Eurostat's index puts Luxembourg and Ireland at the top of the European Union in 2025, followed by the Netherlands and Denmark.
    • Luxembourg, despite one of the highest GDP per capita figures in the world, ranked only 75th worldwide for total GDP in 2025, according to the World Bank.
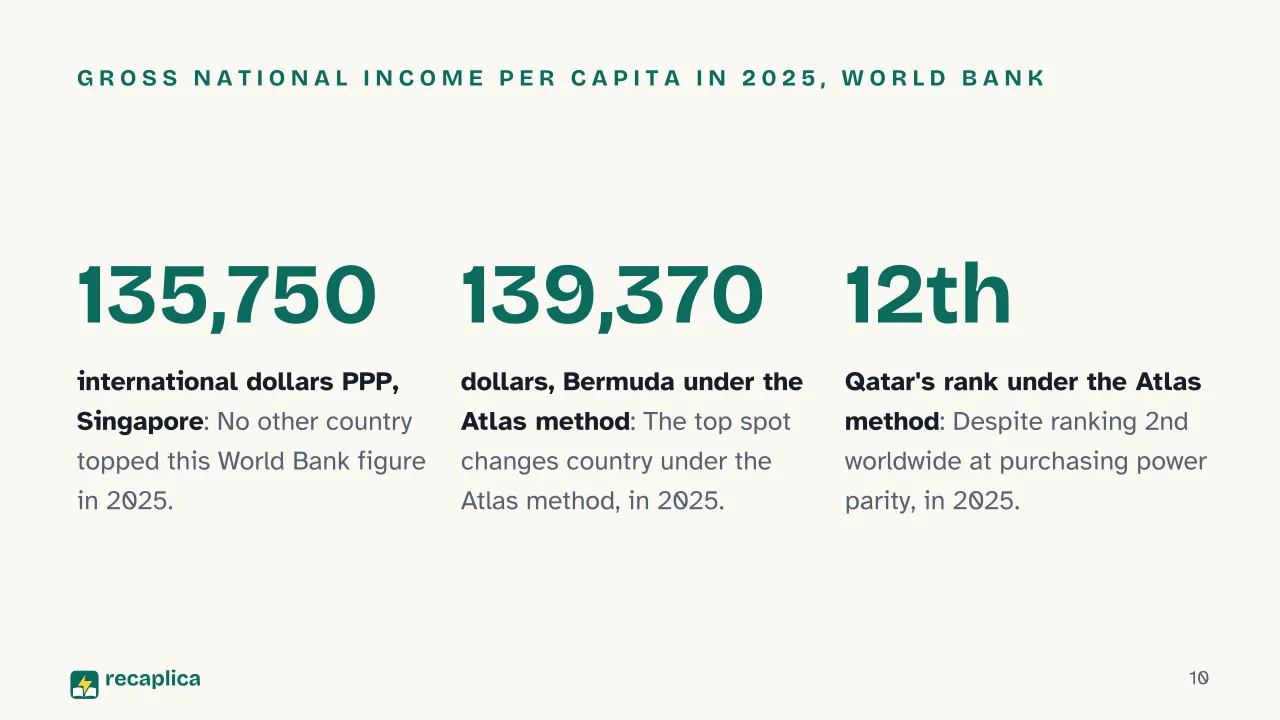
    • Gross national income per capita, calculated by the World Bank, reshuffles the ranking depending on the method: Singapore led at purchasing power parity in 2025, Bermuda under the Atlas method.
    • Qatar shows how much the method matters: 2nd in the world for income per capita at purchasing power parity in 2025, only 12th under the Atlas method.
    • Ireland's GDP per capita index against the EU average climbed from 185% in 2015 to 238% in 2025, a rise Eurostat itself calls unusual.

    Key figures

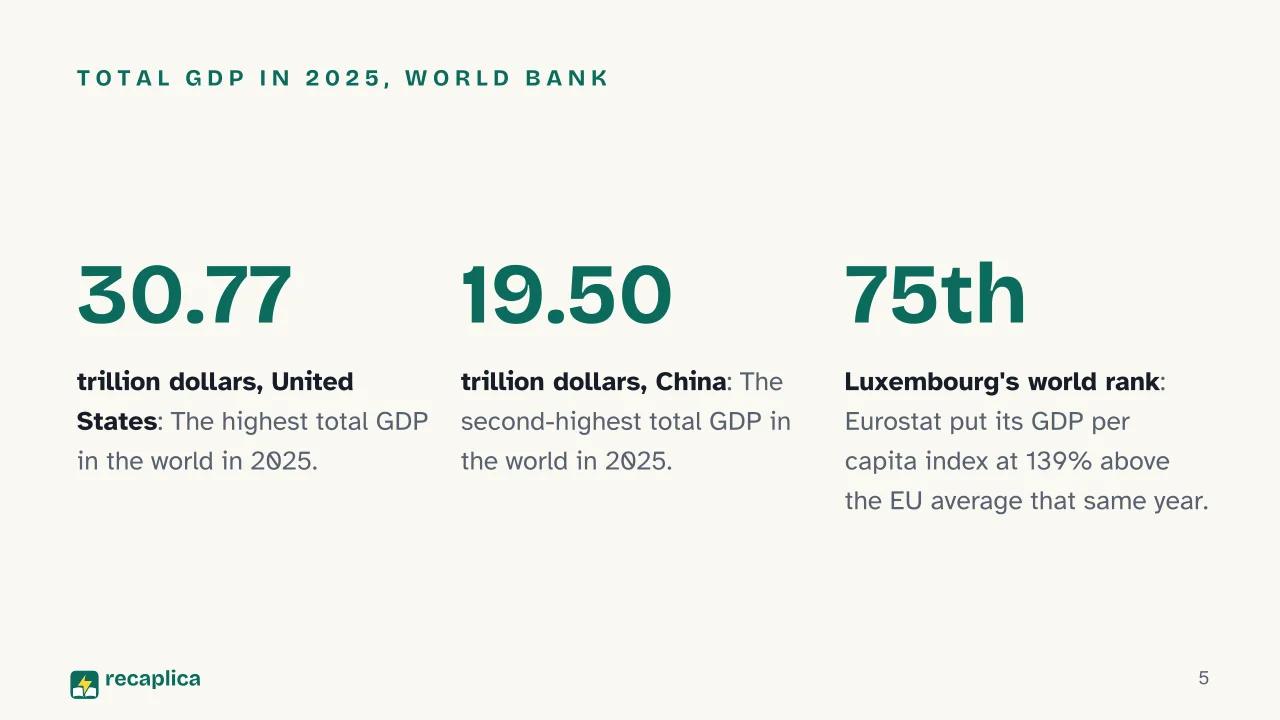
    • $30.77 trillion Total GDP of the United States in 2025, the highest in the world. Source: World Bank, 2025
    • 75th Luxembourg's rank in the world total GDP ranking in 2025, despite a GDP per capita index 139% above the EU average that same year (Eurostat). Source: World Bank, 2025
    • 135,750 international dollars Singapore's gross national income per capita in 2025, the highest in the world at purchasing power parity. Source: World Bank, 2025

    Deep Dive

    The richest country in the world, by total GDP

    By overall economic size, in 2025 the United States had the highest total GDP in the world: about $30.77 trillion, according to the World Bank’s Data Catalog. China came second, with about $19.50 trillion. This is the ranking that answers “which are the biggest economies,” not “where does the average resident live with the most wealth”: you can read it in full in the world GDP ranking.

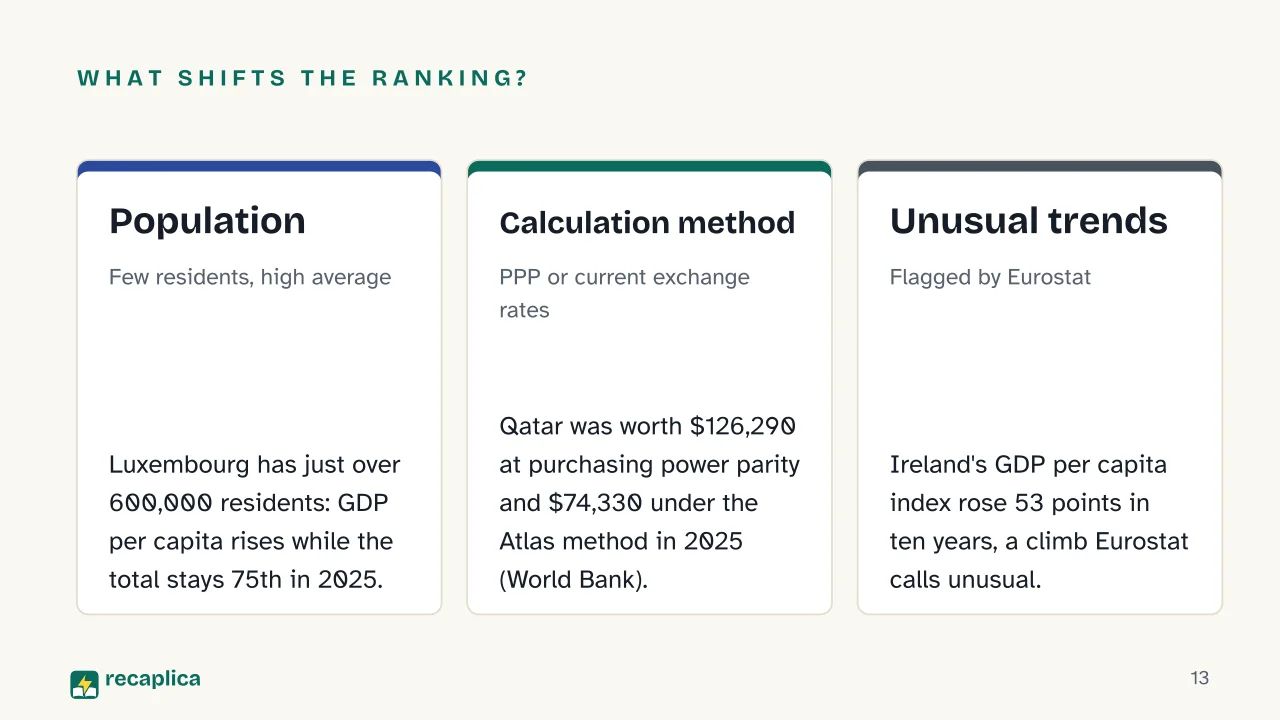
    Total GDP grows with population: a country with more residents adds up more output, regardless of how much each one earns on average. Luxembourg proves the point. In 2025 it sat 75th in the world for total GDP, at about $101,158 million, while its GDP per capita index, according to Eurostat, stood at 139% above the EU average that same year.

    Practical example: comparing Luxembourg and China by total GDP ($101,158 million against $19.50 trillion in 2025) tells the opposite story from dividing that GDP by population: China has over a billion people to spread its economy across, Luxembourg just over 600,000.

    The GDP per capita ranking in Europe

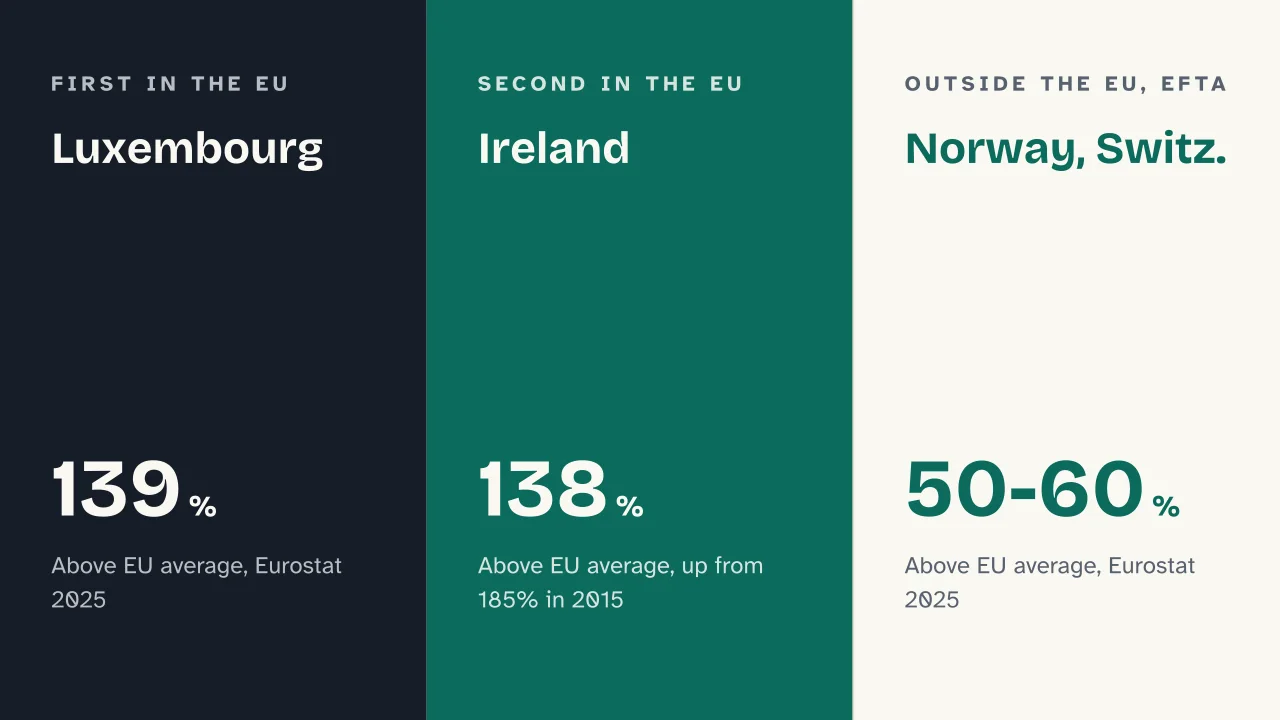
    GDP per capita comes from dividing a country’s economic output by its population, to see how much of it corresponds to each resident on average. Eurostat calculates a GDP per capita index for European countries at purchasing power parity, measured against the EU average. In 2025, according to Eurostat, Luxembourg and Ireland had the highest index among EU countries, followed by the Netherlands and Denmark. Luxembourg’s GDP per capita stood 139% above the EU average in 2025, Ireland’s 138% above it.

    Outside the European Union, Norway and Switzerland, both part of EFTA, had a GDP per capita between 50% and 60% above the EU average in 2025, according to Eurostat. High, but well short of Luxembourg’s 139%.

    CountryGDP per capita (EU index, 2025)Source
    Luxembourg139% above the EU averageEurostat
    Ireland138% above the EU averageEurostat
    Norway and Switzerland (EFTA)50-60% above the EU averageEurostat

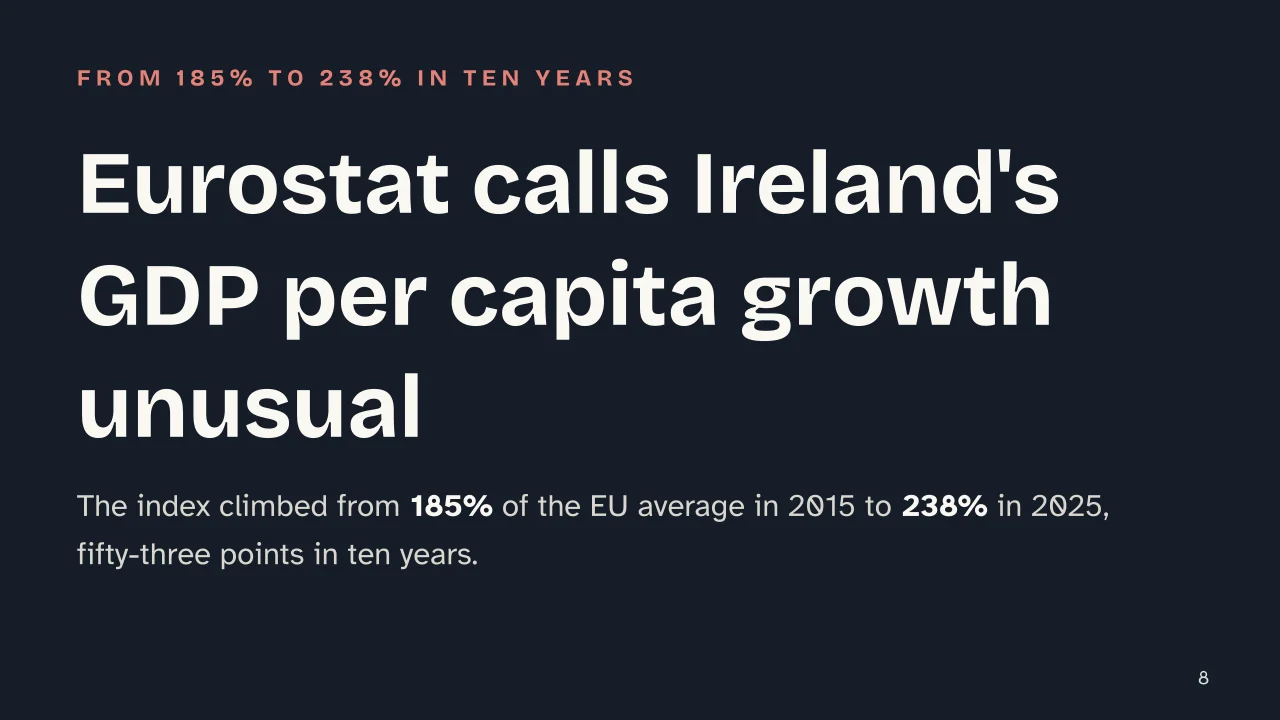
    Ireland’s index deserves a closer look. It rose from 185% of the EU average in 2015 to 238% in 2025, fifty-three points in ten years. Eurostat itself flags this growth as an unusual dynamic compared with the rest of the European Union; the published figure doesn’t say why.

    Income per capita worldwide, across two calculation methods

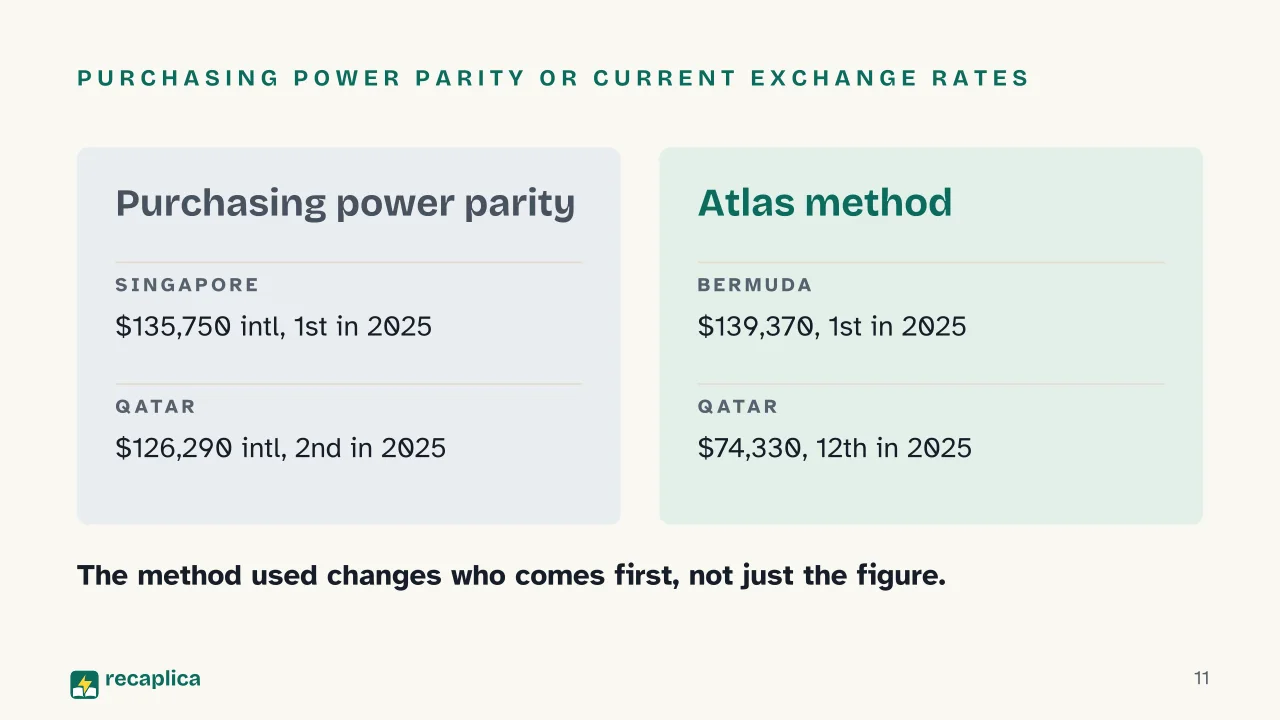
    Outside the area Eurostat’s index covers, the World Bank publishes gross national income (GNI) per capita: a measure that also counts what a country’s residents earn abroad, unlike GDP. In 2025 Singapore had the highest GNI per capita in the world calculated at purchasing power parity, 135,750 international dollars. Under the Atlas method, based on current exchange rates instead of purchasing power, the top spot went to a different country: Bermuda, with 139,370 dollars.

    Qatar is the clearest example of how much the method matters. In 2025 it ranked second in the world for GNI per capita at purchasing power parity, with 126,290 international dollars. Under the Atlas method it dropped to twelfth, with 74,330 dollars.

    An “international dollar” at purchasing power parity represents, according to the World Bank, the same purchasing power a dollar has in the United States: this edition’s PPP figures are built from the 2021 reference estimates of the International Comparison Program.

    Why there’s no single worldwide ranking

    Anyone looking for the richest country in the world finds different answers depending on what gets measured. Total GDP, the EU GDP per capita index and gross national income per capita answer different questions: how much the entire economy produces, how much each resident produces on average compared with other European countries, how much income each resident receives on average once earnings from abroad are counted in. None of these figures says how wealth is actually distributed among the people of a country; that question is covered in Poverty: Definition and How It Differs from Inequality and Underdevelopment.

    The calculation method matters just as much as the criterion chosen. Qatar illustrates it well: at purchasing power parity it ranks 2nd in the world for income per capita, under the Atlas method only 12th. On the other end of the scale, a country’s poverty gets measured with criteria just as specific.

    Slide deck

    Slides ready to download and make your own in PowerPoint or Google Slides, with speaker notes. Pick the Flash cut or the Full one.
    Slide 1 of the presentation on Richest Countries in the World: Richest Countries in the WorldSlide 2 of the presentation on Richest Countries in the World: Which is the richest country in the world?Slide 3 of the presentation on Richest Countries in the World: From the World Bank to EurostatSlide 4 of the presentation on Richest Countries in the World: Chapter 01: Total GDPSlide 5 of the presentation on Richest Countries in the World: Total GDP in 2025, World BankSlide 6 of the presentation on Richest Countries in the World: Chapter 02: GDP per capita in EuropeSlide 7 of the presentation on Richest Countries in the World: Luxembourg · Ireland · Norway, Switz.Slide 8 of the presentation on Richest Countries in the World: Eurostat calls Ireland's GDP per capita growth unusualSlide 9 of the presentation on Richest Countries in the World: Chapter 03: Income per capita worldwideSlide 10 of the presentation on Richest Countries in the World: Gross national income per capita in 2025, World BankSlide 11 of the presentation on Richest Countries in the World: Purchasing power parity or current exchange ratesSlide 12 of the presentation on Richest Countries in the World: Chapter 04: Why the ranking shiftsSlide 13 of the presentation on Richest Countries in the World: What shifts the ranking?: Population, Calculation method, Unusual trendsSlide 14 of the presentation on Richest Countries in the World: Where did Luxembourg rank in the world total GDP ranking in 2025?Slide 15 of the presentation on Richest Countries in the World: Now, time to review
    Flash10 slidesThe essential thread, to present in classFull15 slidesEvery chapter and the deeper detail

    Common myths

    • ✗ Myth The richest country in the world must be the one with the biggest economy.

      ✓ Reality By total GDP, the World Bank puts the United States first and China second in 2025, but that ranking measures the size of an economy, not wealth per resident: Luxembourg ranked only 75th worldwide for total GDP that same year, even though its GDP per capita index stood 139% above the EU average, according to Eurostat.

    • ✗ Myth The country with the highest income per capita is always the same, whatever source you check.

      ✓ Reality The top spot shifts with the World Bank's calculation method: in 2025 Singapore led for gross national income per capita at purchasing power parity, Bermuda led under the Atlas method, and Qatar dropped from 2nd to 12th depending on which method was used.

    • ✗ Myth GDP per capita and gross national income per capita are the same measure under two names.

      ✓ Reality GDP per capita divides a country's economic output by its population; gross national income per capita, calculated by the World Bank, also counts income residents earn abroad. They are distinct measures, even when the figures happen to sit close together.

    Mind map

    Drag the background to move around and the nodes to reposition them; use − and + to collapse and expand branches.
    Customize
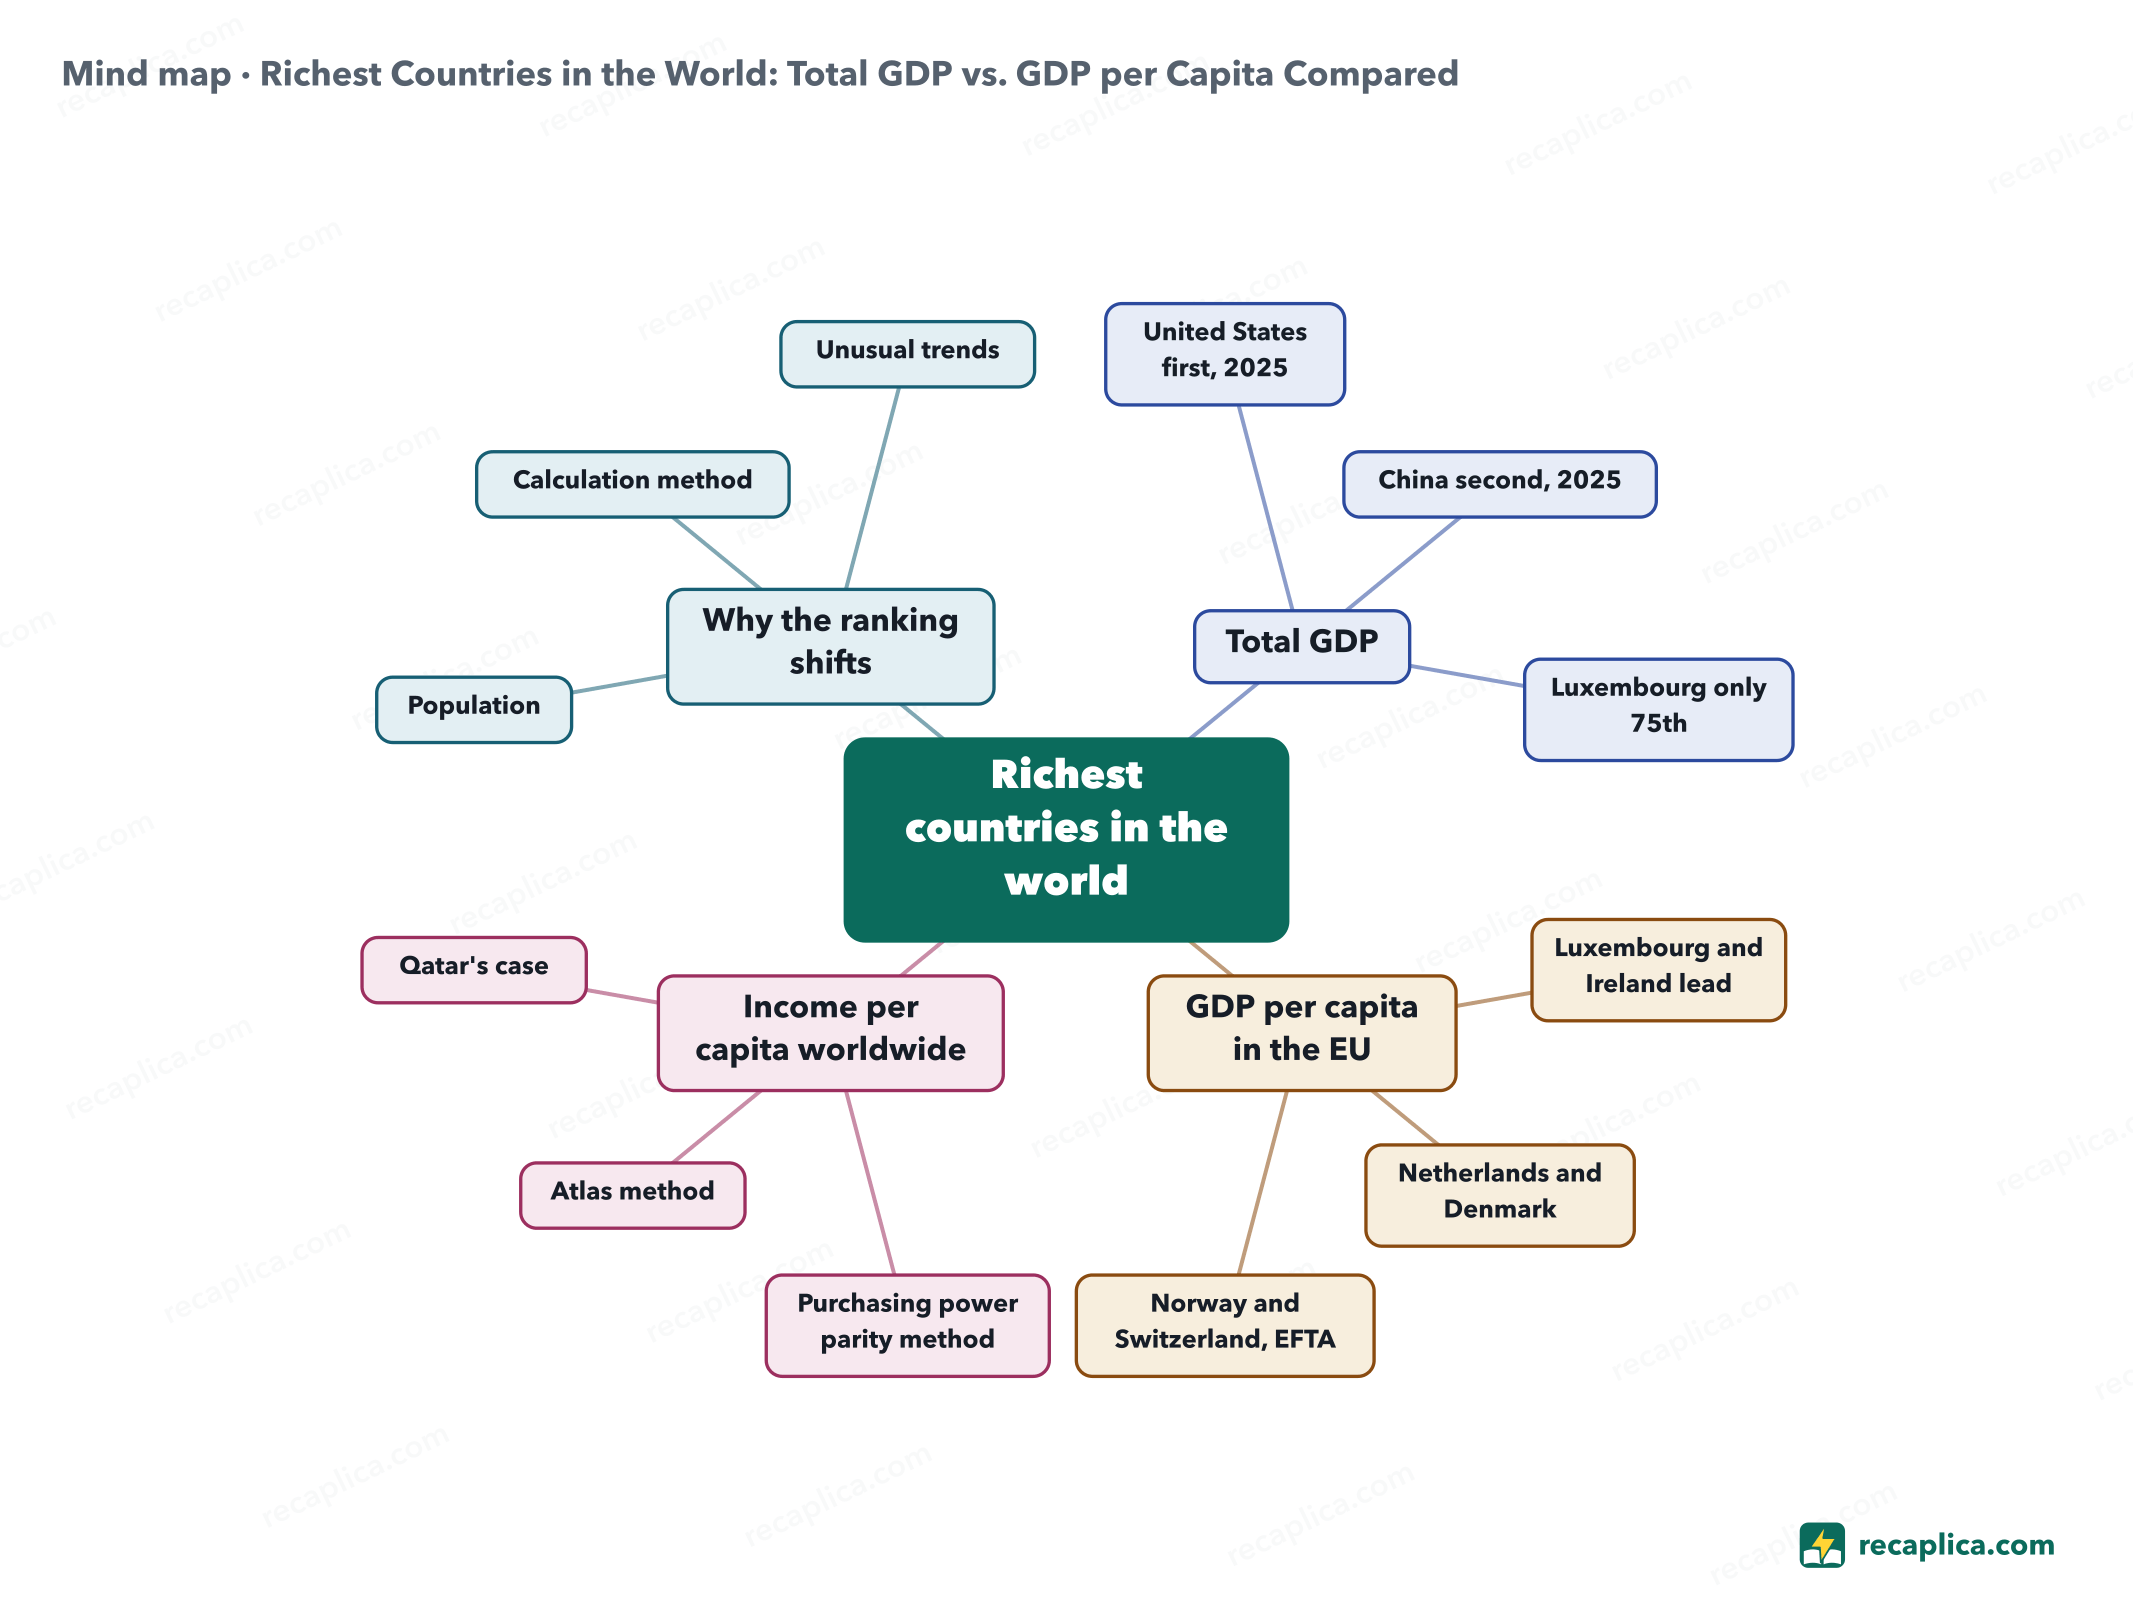
    Mind map: Richest Countries in the World: Total GDP vs. GDP per Capita Compared
    • Richest countries in the world
      • Total GDP
        • United States first, 2025 $30.77 trillion, World Bank
        • China second, 2025 $19.50 trillion
        • Luxembourg only 75th even with a GDP per capita index 139% above the EU average
      • GDP per capita in the EU
        • Luxembourg and Ireland lead Eurostat index 2025, 139% and 138% above the EU average
        • Netherlands and Denmark close behind, Eurostat index 2025
        • Norway and Switzerland, EFTA 50-60% above the EU average, outside the European Union
      • Income per capita worldwide
        • Purchasing power parity method Singapore first in 2025, 135,750 international dollars
        • Atlas method Bermuda first in 2025, $139,370
        • Qatar's case 2nd at purchasing power parity, 12th under Atlas, 2025
      • Why the ranking shifts
        • Population few residents push the per capita figure up
        • Calculation method purchasing power parity and the Atlas method give different results
        • Unusual trends Ireland's index, flagged by Eurostat

    Quiz: test yourself

    Answer the questions to check what you have learned: you get instant feedback and a short explanation.

    Grade 0/10 0/5
    1 Which country had the highest total GDP in the world in 2025, according to the World Bank?

    In 2025 the United States had a total GDP of about $30.77 trillion, the highest in the world according to the World Bank; China came second.

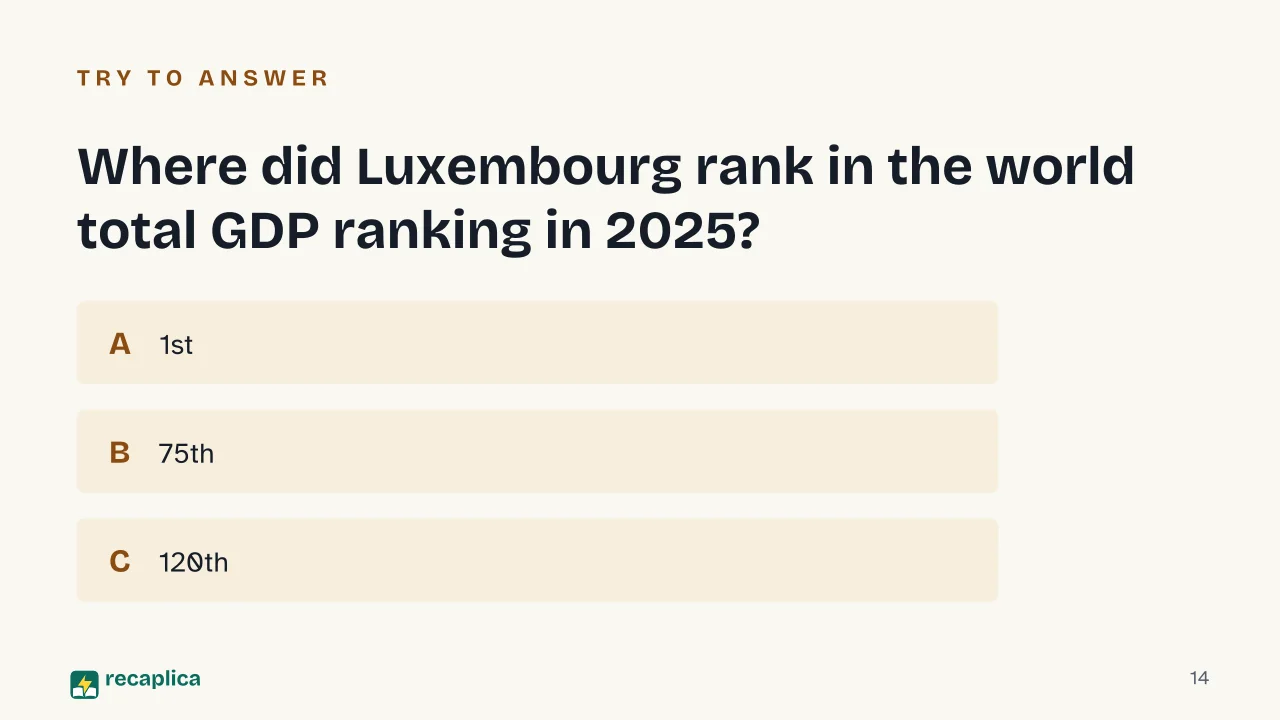
    2 Where did Luxembourg rank in the world total GDP ranking in 2025, according to the World Bank?

    In the World Bank's global ranking, Luxembourg sat 75th in 2025, far from its position in Eurostat's European GDP per capita index.

    3 Which countries had the highest GDP per capita index in the European Union in 2025, according to Eurostat?

    According to Eurostat, in 2025 Luxembourg and Ireland had the highest GDP per capita among EU countries, with the Netherlands and Denmark close behind; Norway and Switzerland sit outside the European Union.

    4 True or false: under the World Bank's Atlas method, the top country for income per capita in 2025 was the same as at purchasing power parity.

    At purchasing power parity, Singapore led the 2025 ranking; under the Atlas method, which relies on current exchange rates, the top spot went to Bermuda instead.

    5 What does Eurostat point out about Ireland's GDP per capita index between 2015 and 2025?

    Ireland's index rose from 185% of the EU average in 2015 to 238% in 2025, a 53-point increase that Eurostat itself calls unusual compared with the rest of the European Union.

    Answers: 1-A · 2-C · 3-A · 4-B · 5-B

    Flashcards

    Tap the card to flip it and check whether you remember the answer, then move to the next one.

    1 / 8

    Explain it in your own words

    The ultimate test: if you can explain it in simple words, you've truly understood it. Write your explanation, then compare it with the Recap.

    Your explanation is saved only on this device.

    The list of richest countries in the world depends on what you measure. By total GDP, the size of a country's whole economy, the United States led in 2025 with China second, according to the World Bank. GDP per capita tells a different story: in 2025 Luxembourg and Ireland had the highest index in the European Union, according to Eurostat, even though Luxembourg ranked only 75th worldwide for total GDP. The World Bank also tracks gross national income per capita, a separate measure from GDP, using two methods that produce different results: Singapore led in 2025 at purchasing power parity, while Bermuda came first under the Atlas method. There is no single answer to which country is richest, because it depends on the measure and the method chosen.

    Frequently asked questions

    What is the richest country in the world?

    It depends on the measure. By total GDP, the World Bank puts the United States first in 2025, followed by China. By GDP per capita within the European Union, Eurostat puts Luxembourg first in the same year. By gross national income per capita worldwide, the World Bank puts Singapore first at purchasing power parity and Bermuda first under the Atlas method, both figures from 2025.

    Which are the richest countries in the world by GDP per capita?

    Within the European Union, according to Eurostat, in 2025 they were Luxembourg (139% above the EU average), Ireland (138%), the Netherlands and Denmark. Outside the EU, Norway and Switzerland had an index between 50% and 60% above the EU average. A worldwide GDP per capita ranking in dollars, built on a single verified method, does not appear to be published in a reliable source: the comparable global measure the World Bank does publish is gross national income per capita, not GDP per capita.

    What is the GDP per capita ranking based on?

    It is a ranking that relates GDP to a country's population, to compare how much each resident weighs, on average, in the overall economic output. Eurostat calculates it for European countries as an index against the EU average, at purchasing power parity: in 2025 Luxembourg had the highest index.

    Why does the ranking of richest countries change between total GDP and GDP per capita?

    Total GDP adds up all of a country's economic output, so it favors large, populous economies like the United States and China. GDP per capita divides that output by the number of residents, so a small country can post a high figure even with modest total GDP: Luxembourg, 75th for total GDP in 2025 according to the World Bank, had a GDP per capita index 139% above the EU average that same year, according to Eurostat.

    Are GDP per capita and income per capita the same thing?

    No. GDP per capita only looks at what is produced within a country's borders, divided by its residents. Gross national income (GNI) per capita, calculated by the World Bank, also folds in what residents bring home from working or investing overseas: the two figures often land close together, but they measure different things.

    Sources

    • Eurostat, GDP per capita, consumption per capita and price level indices
    • World Bank, Gross domestic product 2025 (GDP ranking)
    • World Bank, Gross national income per capita 2025, Atlas method and PPP

    Every Recap goes through an independent review before publication.

    Every evening, the day's new Recaps on our Telegram channel. Join the channel →

    Keep learning

    • Economics Sustainability: Definition, What It Means and the Three Pillars Sustainability, in the fuller phrase sustainable development, is development that covers the needs of the people living now while leaving future generations able to cover their own: that is how the United Nations defines it. The wording comes from Our Common Future, the report published in 1987 by the World Commission on Environment and Development, also called the Brundtland Commission. Treccani lists three interdependent factors behind the expression. The United Nations describe an integrated approach, where environmental concerns travel alongside economic development. Read the Recap →
    • Economics 2008 Financial Crisis: Timeline of How It Started and Spread The 2008 financial crisis began in the United States in the subprime mortgage market, when expanding credit to riskier borrowers and the practice of bundling those mortgages into securities collided with slowing home prices, according to the Federal Reserve. In spring 2008 the investment bank Bear Stearns was rescued with Federal Reserve support, but that September Lehman Brothers filed for bankruptcy and the insurer AIG had to be propped up by the government. Washington responded with TARP, a program Congress authorized for up to $700 billion, and with new bank-supervision rules in 2010. US GDP fell 4.3% and unemployment climbed to about 10%, while in Europe the shock turned, in the following years, into a public-finance crisis that the European Central Bank had to address with government bond purchases. Read the Recap →
    • Economics Fastest Growing Economies in the World: The Real GDP Growth Ranking, Explained According to the International Monetary Fund's projections for 2025, South Sudan tops the ranking for real GDP growth, followed by Guyana and Libya — small economies, or ones tied to a single resource, not the world's biggest ones. GDP growth rate measures, in percentage terms, how much a country's output expands each year, adjusted for inflation. Global real GDP grew 3.4% in 2024 according to the IMF, with emerging economies expanding at more than double the pace of advanced ones. A very high growth rate, though, can come from a rebound after a slump, an oil boom, or even an accounting quirk: on its own, it doesn't prove a stronger economy. Read the Recap →

    recaplica

    Clear in 30 seconds, yours in 10 minutes.

    Recaps Mind maps Request a Recap Telegram channel Mind map maker Our method About Privacy & cookies Legal notes & terms of use

    © 2026 Recaplica · A project by Curi S.r.l. — VAT IT05472000750

    Statistics, only if you say so

    To learn which Recaps help most we would use Google Analytics, with aggregate, anonymous data. It starts only with your OK, and you can change your mind anytime. Privacy policy