Skip to content
recaplica

    One moment: security check

    Cloudflare wants to make sure you're not a robot. Tick the box below and your search will continue on its own.

    IT
    recaplica Vector vs Raster Images: Formats and Compression
    © 2026 Recaplica · recaplica.com — All rights reserved
    Home › Technology

    Vector vs Raster Images: Formats and Compression

    By Recaplica Newsroom · Updated on September 30, 2026

    What to print

    Page numbers appear when printing with default margins.

    Slides

    Choose a cut

    Flash10 slidesThe essential thread, to present in classFull15 slidesEvery chapter and the deeper detail

    Both come with speaker notes.

    Telegram channel
    recaplica Clear in 30 seconds, yours in 10 minutes.
    In 30 seconds Key points Figures Deep dive Slides Myths Mind map Quiz Flashcards FAQ

    In 30 seconds quick read

    A raster image is a grid of pixels, each one holding its own color, and stretching it past its original resolution leaves it blurry or jagged. A vector image stores no pixels at all: it stores mathematical instructions, points, lines, curves, that the computer redraws every time it's shown, which is why it stays sharp at any size. GIF, JPEG and PNG are raster formats, while SVG is the most common vector format on the web. Compression shrinks file size in two different ways: lossy compression throws away part of the data to make the file smaller, lossless compression rebuilds the file exactly as it was.

    Key Points

    • A raster image (also called bitmap) is built from a grid of pixels: stretch it past its resolution and it loses sharpness.
    • A vector image describes shapes with mathematical formulas, points and curves, so it stays sharp at every size.
    • GIF, JPEG and PNG are raster formats; SVG is the leading vector format.
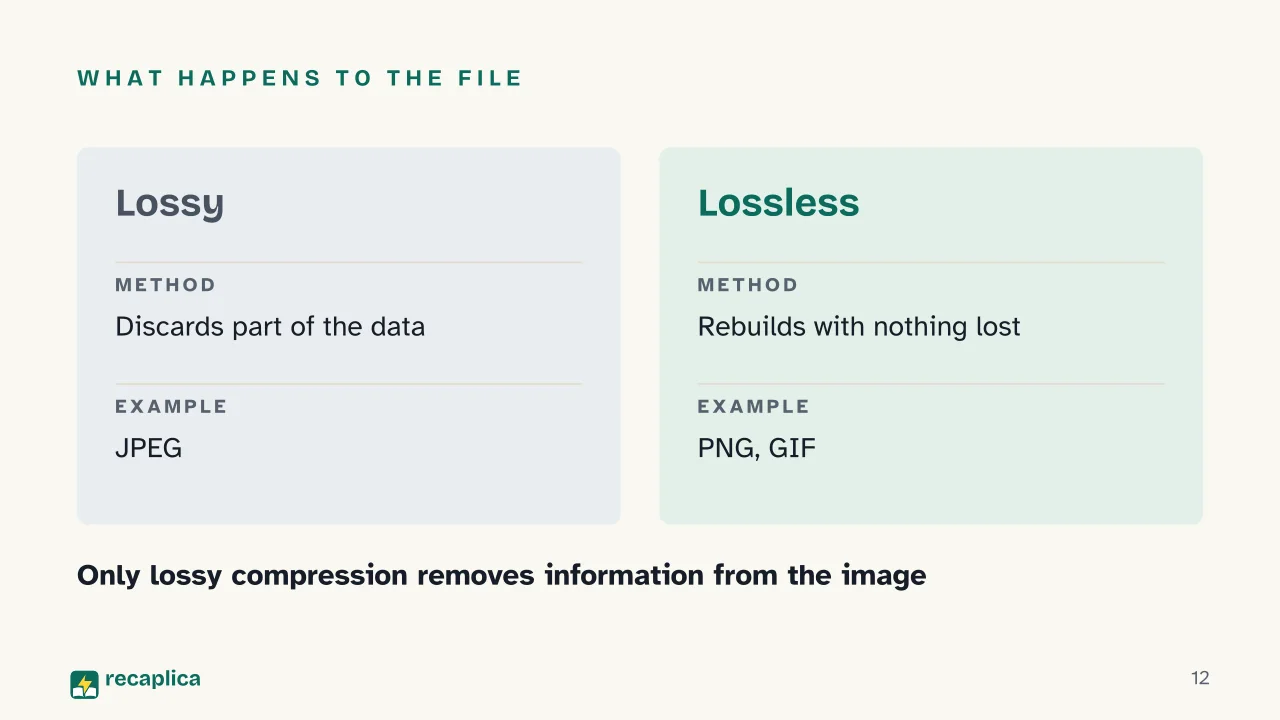
    • Lossy compression, the kind JPEG uses, discards part of the data to make lighter files; lossless compression, used by PNG and GIF, rebuilds the original with nothing missing.
    • Photographs, with their continuous color shading, work better as raster; logos, icons and illustrations work better as vectors.
    • GIF appeared in 1987, the JPEG standard in 1992, and SVG became an official W3C Recommendation in 2001.

    Key figures

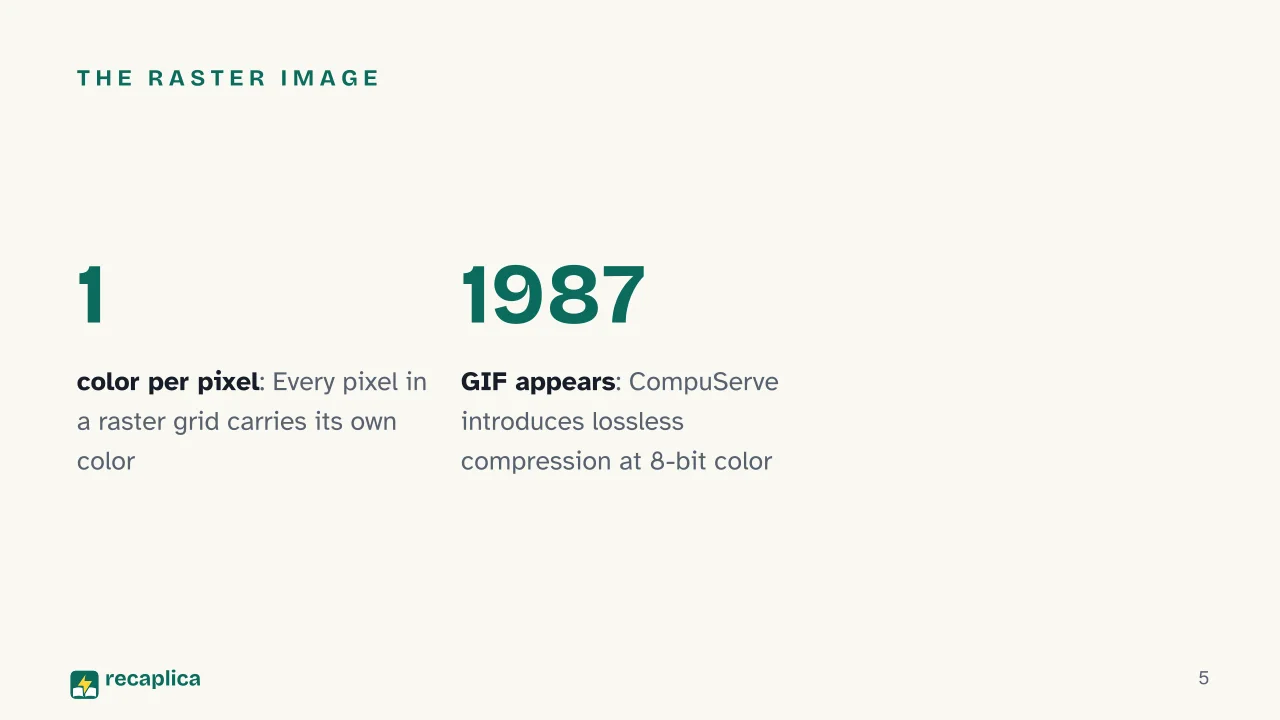
    • 1987 The year CompuServe introduced the GIF format, using lossless compression at 8-bit color depth. Source: MDN Web Docs
    • 1992 The year the JPEG standard (ISO/IEC 10918) was created by the Joint Photographic Experts Group. Source: JPEG.org
    • 2001 The year SVG 1.0 became an official W3C Recommendation. Source: W3C

    Deep Dive

    Every image on a screen is, underneath, a file, and image files get written in two profoundly different ways. The difference isn’t about how sharp they look, but about how they describe the image: as pixels, or as mathematical formulas.

    The grid of pixels

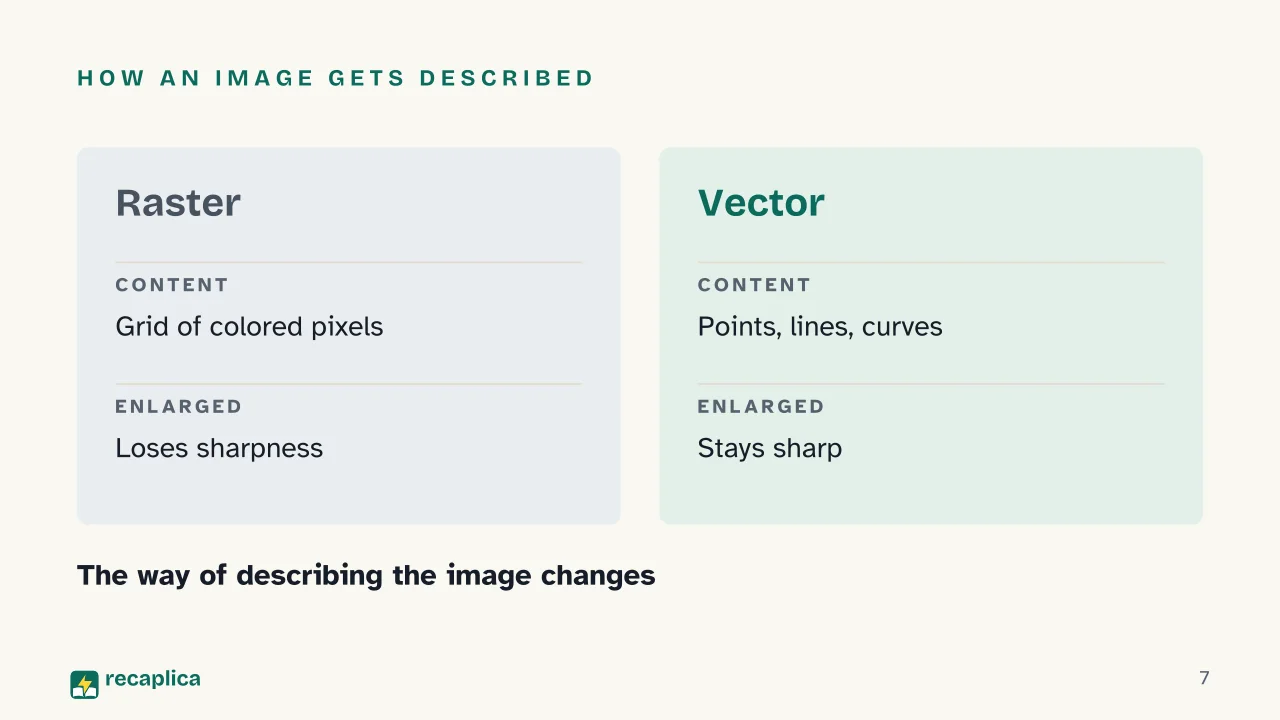
    A raster image (also called bitmap) is a grid of individual dots, pixels, and each one holds its own color. Every pixel, underneath, is a number written in binary code: three values indicating how much red, green and blue that dot contains. When a raster image is enlarged past its original resolution, its edges turn jagged: the file has no extra information to add, so the existing pixels simply get stretched.

    Mathematical instructions

    A vector image contains no pixels at all: it contains instructions. Points connected by lines and curves, called paths, that the computer interprets and redraws every time the image is displayed. Because those paths are numbers rather than fixed dots, a vector image stays sharp at any size, from a postage stamp to a billboard.

    Real-world example: a company logo saved as a vector file can sit on a business card and, without touching the file, get printed on a poster ten feet wide: the lines stay crisp in both cases, because they’re recalculated at every size.

    GIF, JPEG and PNG: three raster formats

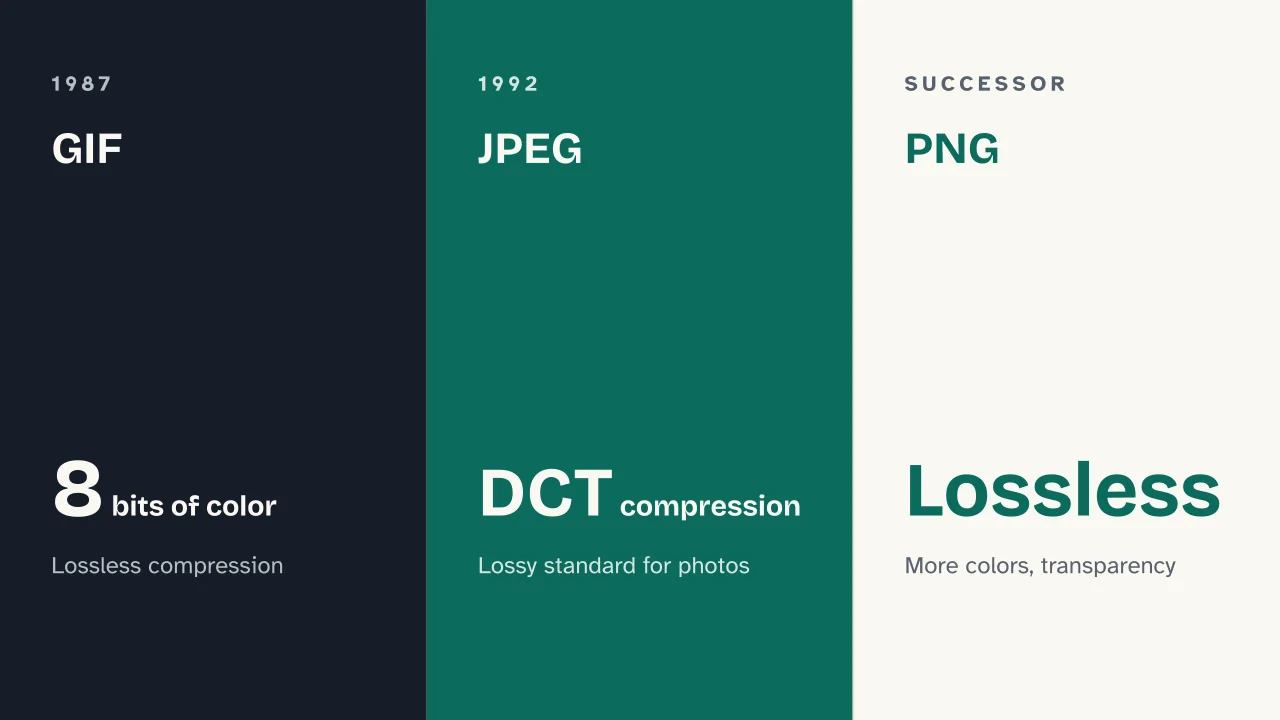
    According to MDN Web Docs, in 1987 CompuServe introduced the GIF format to give every member of its online service a compressed format they could all use: GIF compresses images without loss (lossless), using the LZW algorithm over a palette of 256 colors (8 bits). Those were also the years personal computers were showing up in homes and connecting to early online services: for that backdrop, see the history of the internet.

    The Joint Photographic Experts Group states it created the JPEG standard (ISO/IEC 10918) in 1992, with a revision in 1994. JPEG compresses with loss (lossy), relying on a technique called the discrete cosine transform, and remains the most widely used lossy format for photographs.

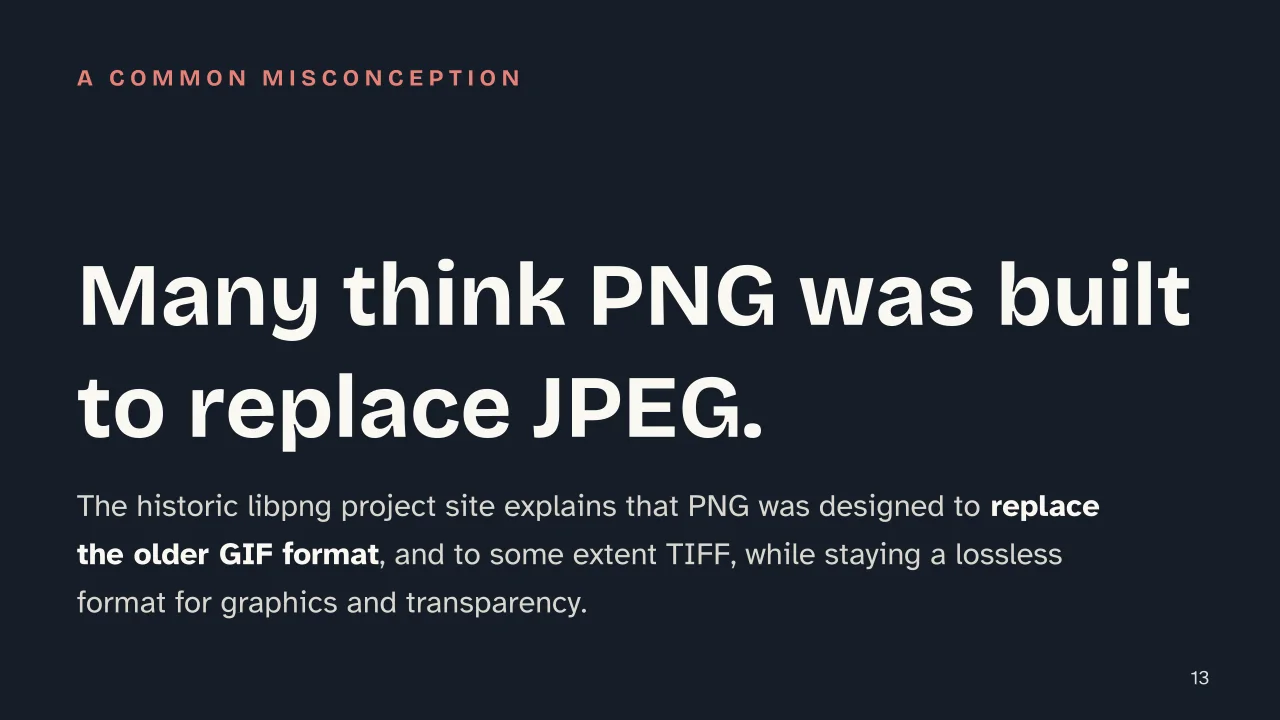
    PNG, according to MDN Web Docs, uses lossless compression and supports more colors than GIF, plus full transparency. The historic libpng project site explains that PNG was designed to replace the older GIF format and, to some extent, the more complex TIFF format: neither of the two sources consulted, however, states an exact birth year in a direct sentence, so it’s fair to say only that PNG showed up in the mid-1990s, without leaning on a date that no source states outright.

    FormatCompression typeYear
    GIFLossless, 8-bit color1987
    JPEGLossy, discrete cosine transform1992
    PNGLossless, more colors and transparencymid-1990s (no confirmed year in the source)

    SVG, the vector format of the web

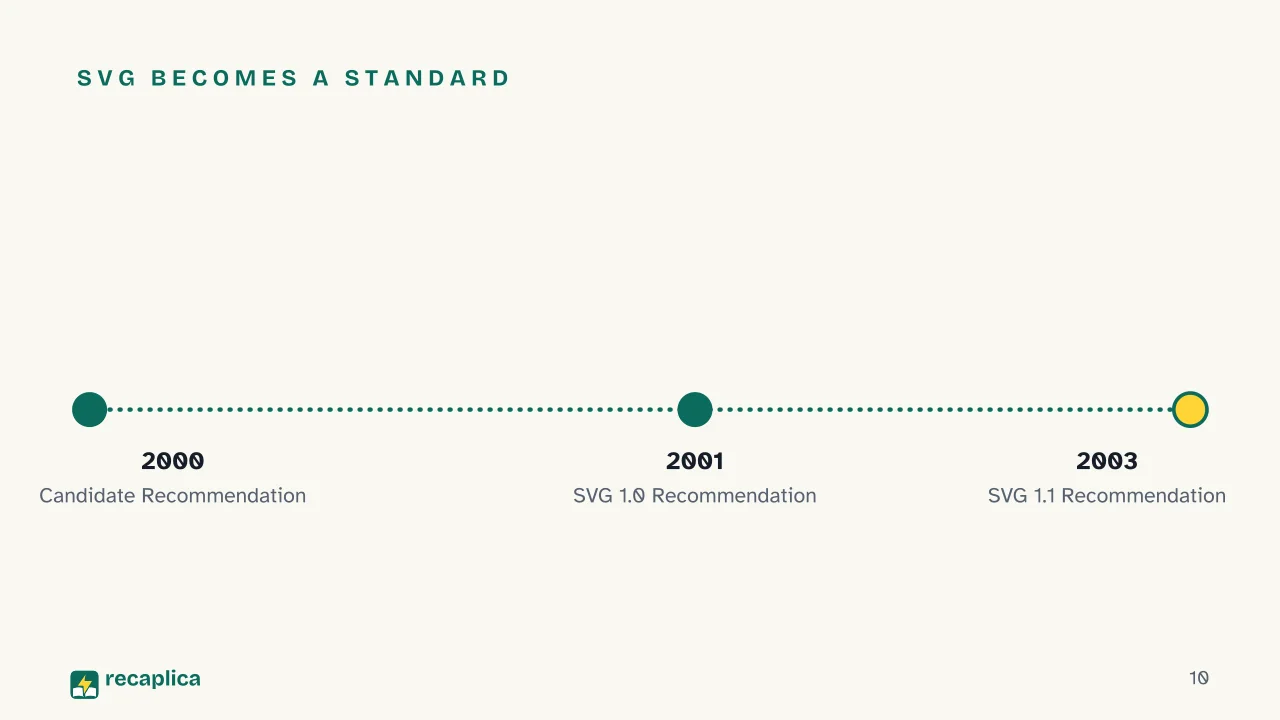
    SVG is an XML-based format that, according to MDN Web Docs, describes an image as a set of drawing commands: shapes, lines, colors, filters. The W3C published a first draft (Candidate Recommendation) in August 2000, then the official SVG 1.0 Recommendation in September 2001, followed by SVG 1.1 in January 2003. MDN Web Docs also flags the format’s limit: SVG is the ideal choice when an image can be represented as a series of drawing commands, especially when the final display size isn’t known ahead of time, but it isn’t built for strictly photographic images.

    Lossy and lossless: what happens when a file gets compressed

    Compression shrinks the weight of an image file, but it does so in two opposite ways. Lossy compression discards part of the image’s data to produce a much smaller file: that’s JPEG’s approach. Lossless compression, instead, reorganizes the data more efficiently but rebuilds it identically to the original once the file is reopened: that’s the approach behind GIF and PNG.

    The procedure that decides how to group or discard that data is an algorithm, applied systematically to every file.

    When to choose raster, when to choose vector

    Teaching materials such as those from the City University of New York offer a practical rule: use the vector format for text, line art and illustrations, and reserve raster for photographs or images with complex, non-uniform shading.

    Content typeRecommended formatWhy
    PhotographsRaster (JPEG)Continuous color shading, hard to reduce to shapes
    Logos and iconsVector (SVG)Clean outlines, needs to stay sharp at every size
    Line illustrationsVector (SVG)Built from paths, scale without losing quality
    Screenshots and already-raster imagesRaster (PNG)Lossless compression, no loss of detail

    Slide deck

    Slides ready to download and make your own in PowerPoint or Google Slides, with speaker notes. Pick the Flash cut or the Full one.
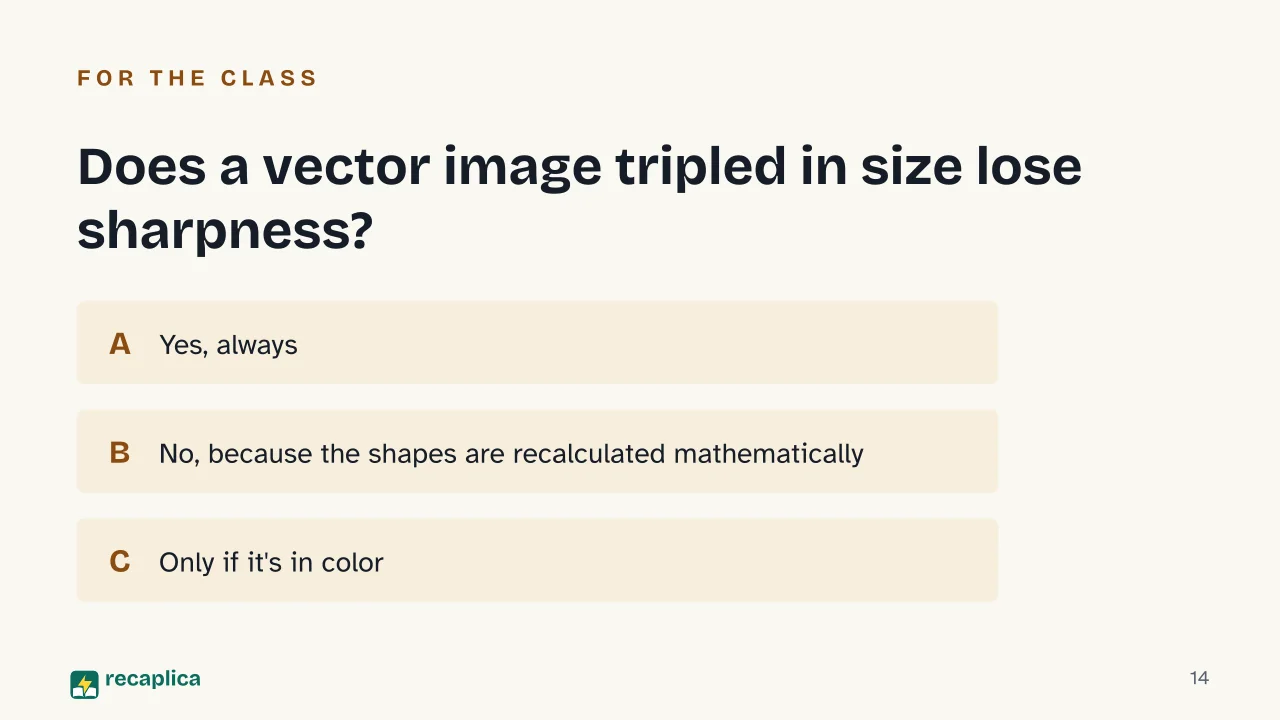
    Slide 1 of the presentation on Vector vs Raster Images: Raster and vectorSlide 2 of the presentation on Vector vs Raster Images: What is an image, to a computer?Slide 3 of the presentation on Vector vs Raster Images: The route aheadSlide 4 of the presentation on Vector vs Raster Images: Chapter 01: The world of pixelsSlide 5 of the presentation on Vector vs Raster Images: The raster imageSlide 6 of the presentation on Vector vs Raster Images: Chapter 02: Mathematical instructionsSlide 7 of the presentation on Vector vs Raster Images: How an image gets describedSlide 8 of the presentation on Vector vs Raster Images: Chapter 03: The main formatsSlide 9 of the presentation on Vector vs Raster Images: GIF · JPEG · PNGSlide 10 of the presentation on Vector vs Raster Images: SVG becomes a standardSlide 11 of the presentation on Vector vs Raster Images: Chapter 04: CompressionSlide 12 of the presentation on Vector vs Raster Images: What happens to the fileSlide 13 of the presentation on Vector vs Raster Images: Many think PNG was built to replace JPEG.Slide 14 of the presentation on Vector vs Raster Images: Does a vector image tripled in size lose sharpness?Slide 15 of the presentation on Vector vs Raster Images: Want to go deeper
    Flash10 slidesThe essential thread, to present in classFull15 slidesEvery chapter and the deeper detail

    Common myths

    • ✗ Myth Enlarging a photo or converting it to SVG makes it as sharp as a vector drawing.

      ✓ Reality A photograph has color shading too complex to describe as a set of geometric shapes: teaching materials on the topic point to raster as the right format for photos and images with complex shading, while vector formats stay built for lines, text and illustrations.

    • ✗ Myth Compressing an image always means losing quality.

      ✓ Reality There are two separate paths: lossless compression, used by PNG and GIF, shrinks the file by rebuilding the image exactly as it was, with nothing discarded; only lossy compression, the kind JPEG uses, throws data away.

    • ✗ Myth PNG was built to replace JPEG.

      ✓ Reality According to the historic libpng project site, PNG was built as a replacement for the older GIF and, to some extent, for TIFF: it remains a lossless format meant for graphics and transparency, built for a different purpose than JPEG's photo compression.

    Mind map

    Drag the background to move around and the nodes to reposition them; use − and + to collapse and expand branches.
    Customize
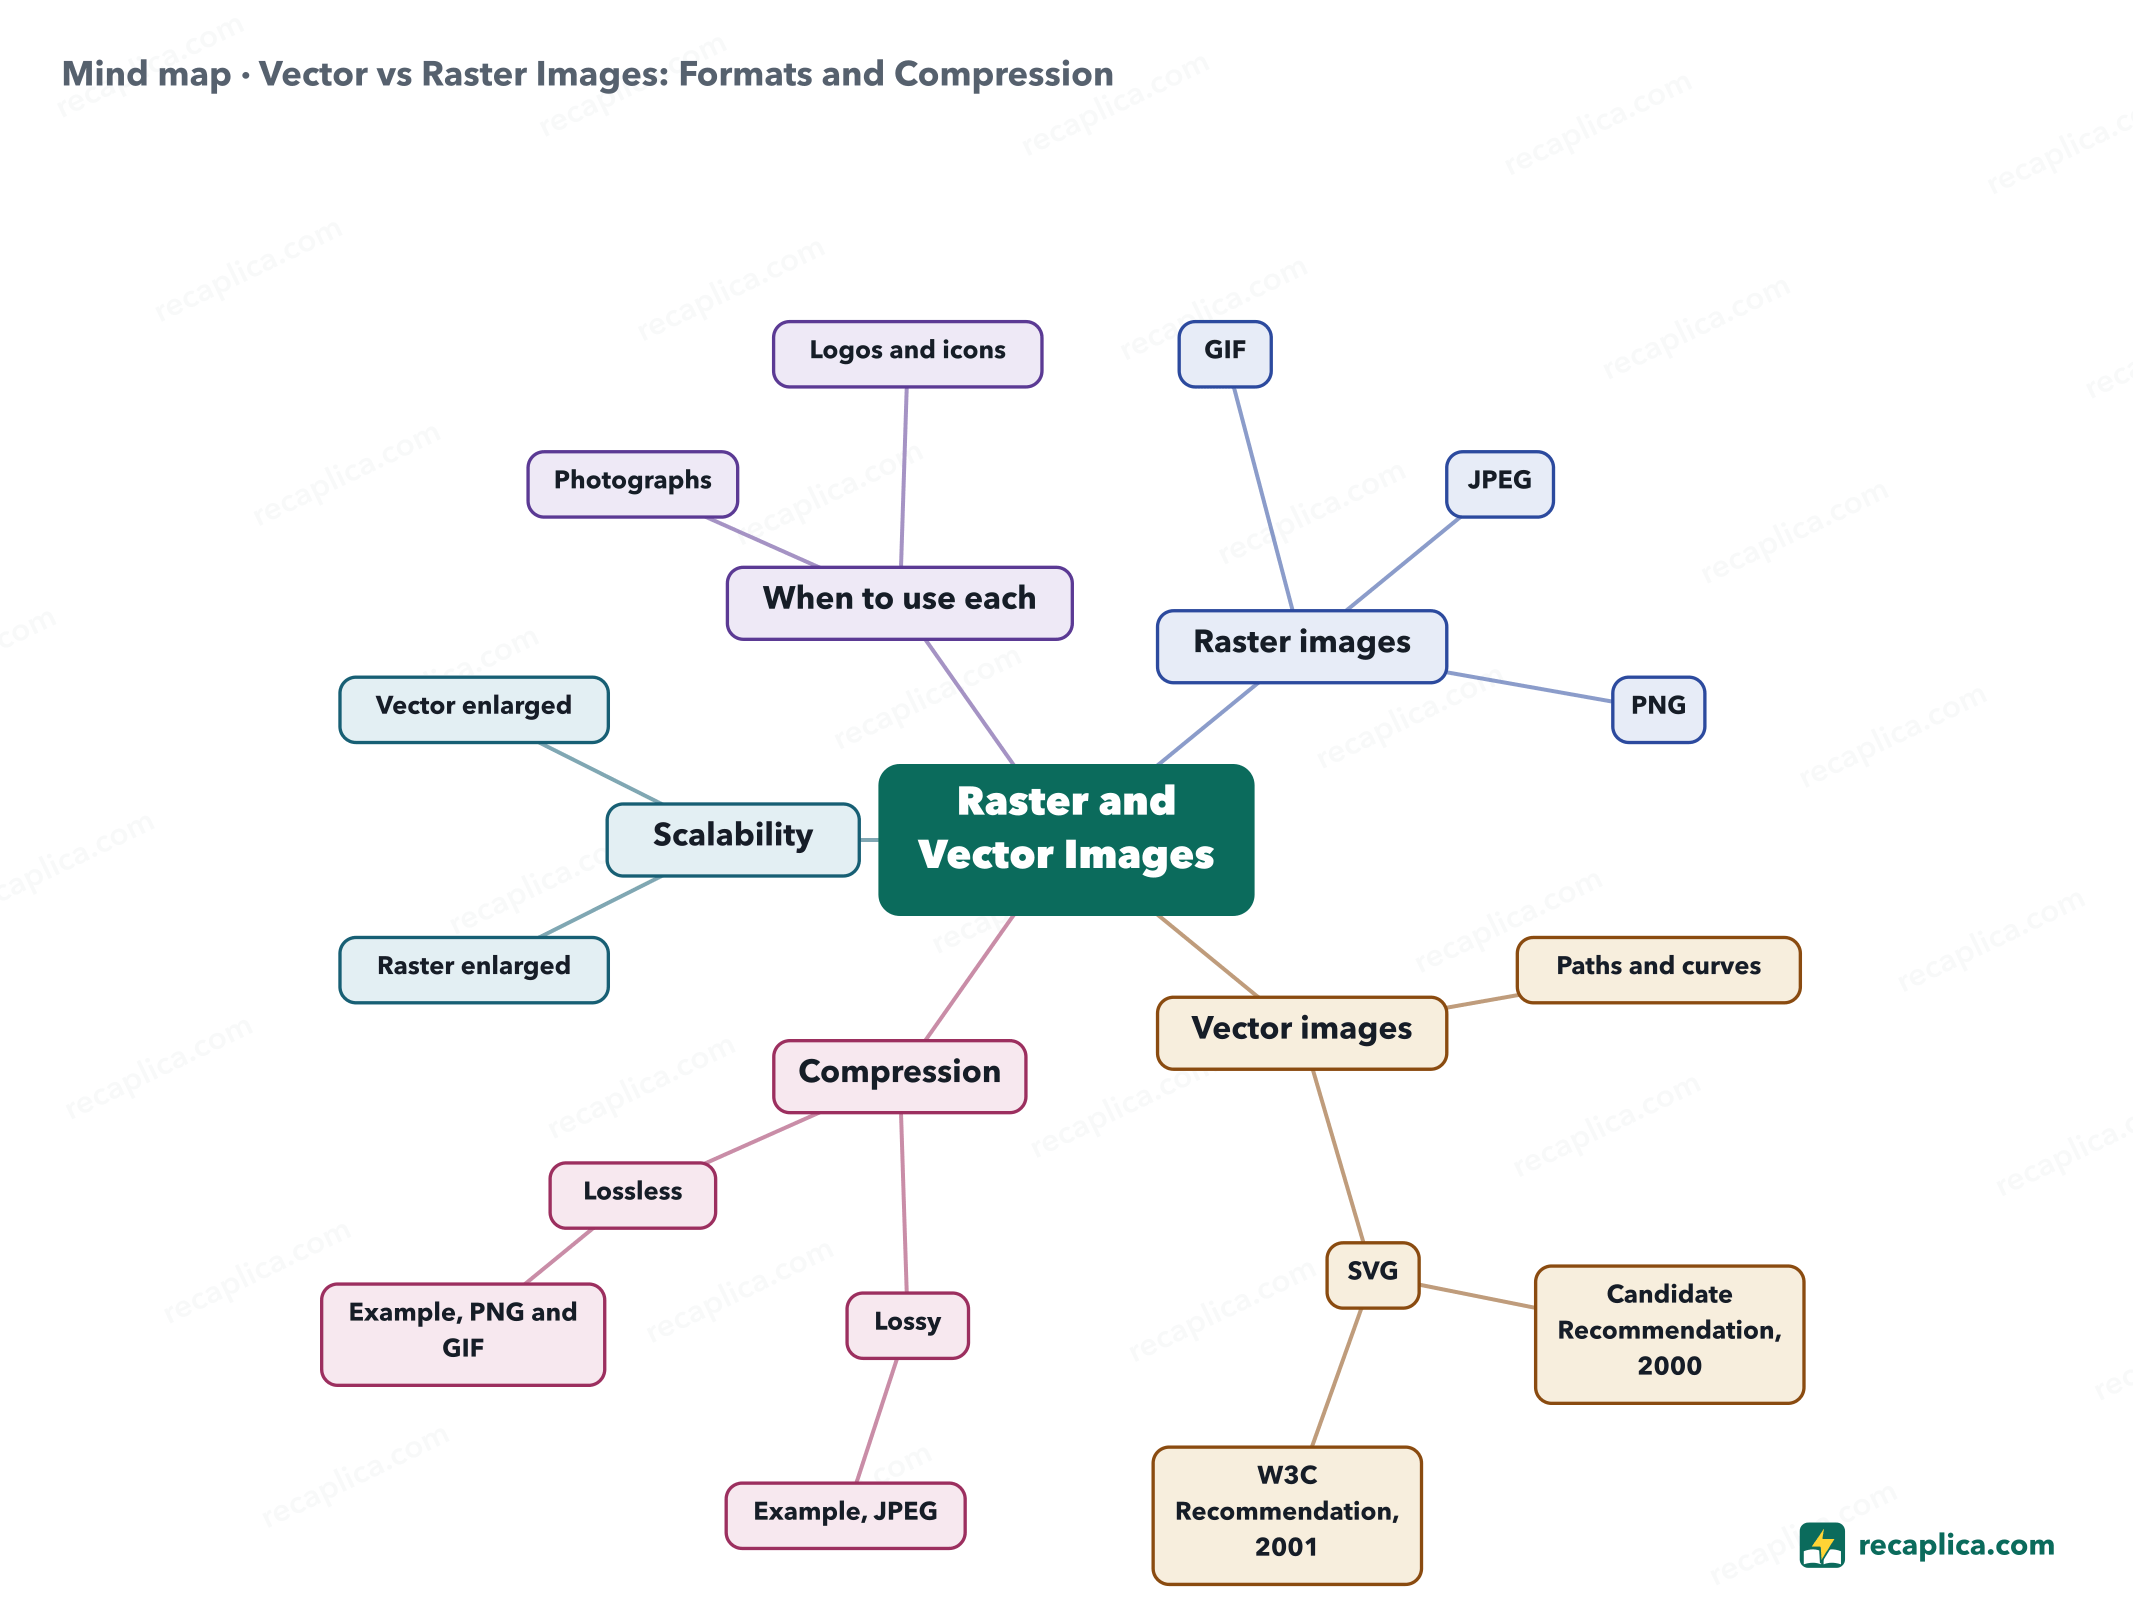
    Mind map: Vector vs Raster Images: Formats and Compression
    • Raster and Vector Images
      • Raster images Pixels in a grid, one color each
        • GIF 1987, lossless compression at 8-bit color
        • JPEG 1992, lossy compression built for photos
        • PNG Lossless, GIF's successor, supports transparency
      • Vector images Mathematical instructions, not pixels
        • Paths and curves Points joined by lines, not pixels
        • SVG XML-based format, the web standard
          • Candidate Recommendation, 2000
          • W3C Recommendation, 2001
      • Compression Two ways to shrink a file
        • Lossy Discards data, smaller file
          • Example, JPEG
        • Lossless No information is lost
          • Example, PNG and GIF
      • Scalability
        • Raster enlarged Loses sharpness, turns jagged
        • Vector enlarged Stays sharp at every size
      • When to use each
        • Photographs Complex shading, better as raster
        • Logos and icons Clean shapes, better as vector

    Quiz: test yourself

    Answer the questions to check what you have learned: you get instant feedback and a short explanation.

    Grade 0/10 0/5
    1 What actually separates a raster image from a vector image?

    Raster is a grid of pixels colored one by one; vector describes shapes through mathematical relationships between points and curves, as teaching materials on the subject explain.

    2 Why doesn't an enlarged vector image lose sharpness?

    A vector image's paths are numbers describing curves: the computer redraws them from scratch at any size, so nothing gets blurred.

    3 Which format appeared in 1987 with lossless compression at 8-bit color depth?

    According to MDN Web Docs, CompuServe introduced GIF in 1987 so that every member of its online service could use one shared compressed format.

    4 What's the difference between lossy and lossless compression?

    MDN Web Docs draws the line this way: lossy compression discards data to get much smaller files, lossless compression reproduces the original exactly.

    5 True or false: SVG describes an image as a grid of colored pixels.

    False: SVG describes an image with drawing commands, shapes, lines, text, not a grid of pixels. That's exactly what makes it a vector format.

    Answers: 1-A · 2-B · 3-A · 4-A · 5-B

    Flashcards

    Tap the card to flip it and check whether you remember the answer, then move to the next one.

    1 / 8

    Explain it in your own words

    The ultimate test: if you can explain it in simple words, you've truly understood it. Write your explanation, then compare it with the Recap.

    Your explanation is saved only on this device.

    A raster image is a grid of pixels, each one holding its own color, and stretching it past its original resolution leaves it blurry or jagged. A vector image stores no pixels at all: it stores mathematical instructions, points, lines, curves, that the computer redraws every time it's shown, which is why it stays sharp at any size. GIF, JPEG and PNG are raster formats, while SVG is the most common vector format on the web. Compression shrinks file size in two different ways: lossy compression throws away part of the data to make the file smaller, lossless compression rebuilds the file exactly as it was.

    Frequently asked questions

    What's the difference between a raster image and a vector image?

    Raster stores the color of every single pixel in a grid; vector stores mathematical instructions, points and curves, that the computer uses to redraw the shapes at any size. That's why vector images stay sharp when enlarged, while raster images lose definition.

    Why do photographs get saved as JPEG instead of SVG?

    A photograph has continuous, complex color shading that's hard to describe as a set of geometric shapes. SVG is built for lines, text and illustrations with clean outlines, while JPEG is the lossy standard made specifically for photographic images.

    What does it mean for compression to be lossless?

    It means the compressed file, once reopened, reproduces the original image identically, with no information discarded. PNG and GIF use lossless compression; JPEG, by contrast, uses lossy compression that discards part of the data.

    What year did the SVG format appear?

    SVG 1.0 became an official W3C Recommendation in 2001, after a draft (Candidate Recommendation) circulated in 2000; a later version, SVG 1.1, became a Recommendation in 2003.

    Sources

    • MDN Web Docs, Image file type and format guide
    • W3C, Portable Network Graphics (PNG) Specification, Third Edition
    • libpng.org, PNG (Portable Network Graphics) Home Site
    • W3C, Scalable Vector Graphics (SVG) 2, Introduction
    • W3C, Scalable Vector Graphics, History
    • CUNY OpenLab, Image Basics, Raster and Vector Graphics
    • JPEG.org, The JPEG Standard

    Every Recap goes through an independent review before publication.

    Every evening, the day's new Recaps on our Telegram channel. Join the channel →

    Keep learning

    • Technology OOP: What Is Object-Oriented Programming Object-oriented programming, or OOP, builds software around objects that bundle data and the functions that act on it, instead of keeping the two apart. Every object comes from a class, the blueprint that fixes its state and behavior, the same way one bicycle model fixes what every bike built from it can do. Documentation across languages keeps circling back to four recurring ideas — encapsulation, inheritance, polymorphism, and abstraction — though not every source tells the story the same way. Java, Python, and C++ each implement OOP with their own mechanics, and none of the sources treats it as the only way to write software. Read the Recap →
    • Technology DBMS: What It Is, the Main Types, and Real Examples A DBMS, short for database management system, is the software that lets people create, query and update the data in a database without having to know how that data is physically stored. Compared with spreadsheets or scattered files, it keeps data in one place and more consistent, cutting down on duplication and security gaps. The most common type is the relational model, which organizes data into linked tables and is queried with SQL. Nonrelational, or NoSQL, systems handle more flexible data, and two older models, hierarchical and network, sit alongside an object-oriented model. Read the Recap →
    • Technology ER Diagram (Entity-Relationship Diagram): What It Is and How to Build One An entity-relationship diagram, or ER diagram, is the map database designers draw before building a database: it shows which objects need tracking (entities), what information describes them (attributes) and how they connect to each other (relationships). It's a conceptual design step, not the finished database schema — the translation into real tables comes later. The two most common notations are Chen, which uses rectangles and ovals, and Crow's Foot, which uses lines ending in circles, bars and crow's feet to show how many instances connect. A relationship can be one-to-one, one-to-many or many-to-many, and each type has its own way of being drawn. Read the Recap →

    recaplica

    Clear in 30 seconds, yours in 10 minutes.

    Recaps Mind maps Request a Recap Telegram channel Mind map maker Our method About Privacy & cookies Legal notes & terms of use

    © 2026 Recaplica · A project by Curi S.r.l. — VAT IT05472000750

    Statistics, only if you say so

    To learn which Recaps help most we would use Google Analytics, with aggregate, anonymous data. It starts only with your OK, and you can change your mind anytime. Privacy policy