|
recaplica
ER Diagram (Entity-Relationship Diagram): What It Is and How to Build One | ||||||||||||||||||||||||||||||||||||||||||
| © 2026 Recaplica · recaplica.com — All rights reserved | ||||||||||||||||||||||||||||||||||||||||||
ER Diagram (Entity-Relationship Diagram): What It Is and How to Build OneWhat to print Page numbers appear when printing with default margins. SlidesChoose a cut Flash10 slidesThe essential thread, to present in classFull15 slidesEvery chapter and the deeper detailBoth come with speaker notes. In 30 seconds quick readAn entity-relationship diagram, or ER diagram, is the map database designers draw before building a database: it shows which objects need tracking (entities), what information describes them (attributes) and how they connect to each other (relationships). It's a conceptual design step, not the finished database schema — the translation into real tables comes later. The two most common notations are Chen, which uses rectangles and ovals, and Crow's Foot, which uses lines ending in circles, bars and crow's feet to show how many instances connect. A relationship can be one-to-one, one-to-many or many-to-many, and each type has its own way of being drawn. Key Points
Deep DiveAn entity-relationship diagram (ER diagram) is how database designers plan the structure of a database before they build it for real. GeeksforGeeks describes the ER model as “a conceptual model for designing a database”: a layer of reasoning upstream of the tables, where you decide what to track and how it connects, not yet how it’s physically stored. An ER diagram isn’t an algorithm that solves a problem step by step, but the reasoning behind it is similar: it breaks a complex domain down — thought through in the abstract, the way an algorithm does — into smaller, connected pieces. Sites built in JavaScript or PHP, behind the scenes, also sit on a database that was planned upstream with a diagram of exactly this kind. For a broader look at what a database is and the types that exist, the Recap on database management systems is the place to start; this Recap zooms in on the technique for designing one before writing it. The Three Basic Building BlocksAn ER diagram is built from three elements. Visual Paradigm defines an entity as “a definable thing or concept within a system” — a person or role (for example a Student), an object (an Invoice), a concept (a Profile) or an event (a Transaction). GeeksforGeeks gives a concrete example: Student, Course or Company are entities. An attribute, per Visual Paradigm, is “a property or characteristic” of the entity that holds it: GeeksforGeeks points to StudentID, CourseName or EmployeeEmail as examples. And a relationship, finally, is the connection that shows two entities are associated with each other — the simplest example, again from GeeksforGeeks, is “Student enrolls in a Course.” Cardinality: How Many Instances ConnectDefining entities, attributes and relationships isn’t enough: you also need to say how many instances of one entity connect to how many instances of the other. That’s cardinality, which Visual Paradigm describes as the number of possible occurrences of one entity associated with the number of occurrences of another. GeeksforGeeks offers three minimal examples, one for each cardinality type:
The database design textbook by Watt and Eng adds a practical note: a one-to-many relationship “should be the norm in any relational database design,” meaning it’s the most common type in relational databases. The same source also notes that a many-to-many relationship “cannot be implemented as such in the relational model”: it doesn’t translate directly into a single table, and needs an extra step during conversion into the actual database. The Two Notations: Chen and Crow’s FootStandard symbols exist for drawing entities, attributes, relationships and cardinality, collected into two different notations. Chen notation, according to GeeksforGeeks, uses a distinct geometric shape for each element:
Crow’s Foot notation, explained by freeCodeCamp, represents cardinality instead with marks at the ends of the lines that connect entities:
Visual Paradigm confirms the same idea from another angle: “In an ER diagram, cardinality is represented as a crow’s foot at the connector’s ends.” freeCodeCamp also gives two minimal examples: in a Teacher-Course relationship, a teacher teaches “one and only one” course, while a course is taught by “one or many” teachers; in a Customer-Pizza relationship, a customer orders “zero or many” pizzas, and a pizza is ordered by “zero or many” customers. How to Build One: A Step-by-Step Example
A diagram like this, with its entities, attributes and cardinality-marked relationships, is the starting point from which the actual database tables get written: for the general concepts of what a database is and how it works, the Recap on database management systems remains the place to go. Slide deckSlides ready to download and make your own in PowerPoint or Google Slides, with speaker notes. Pick the Flash cut or the Full one.     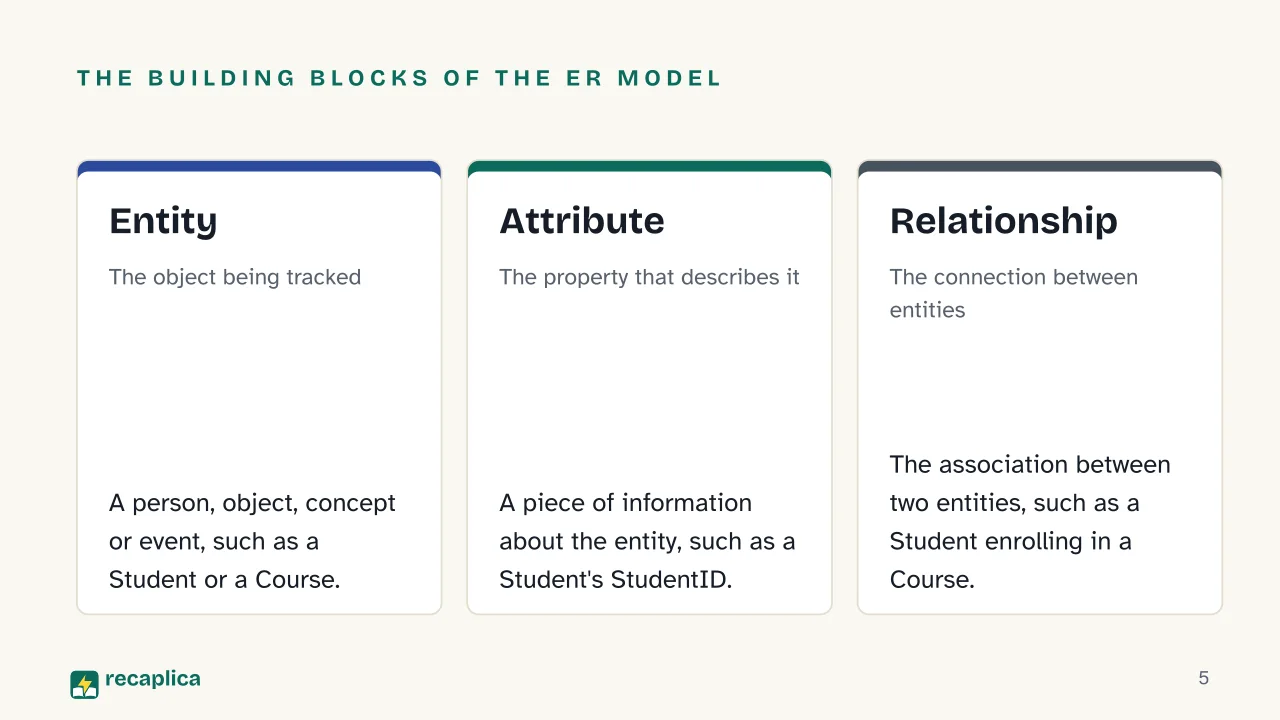  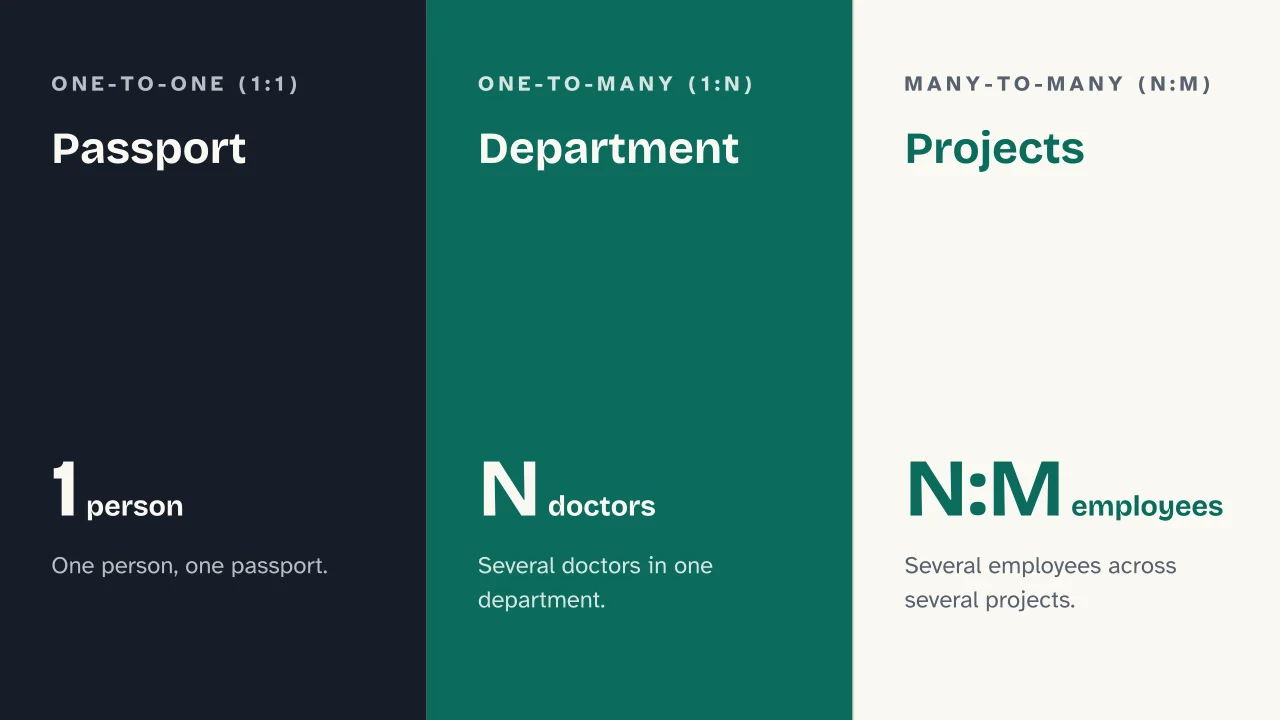  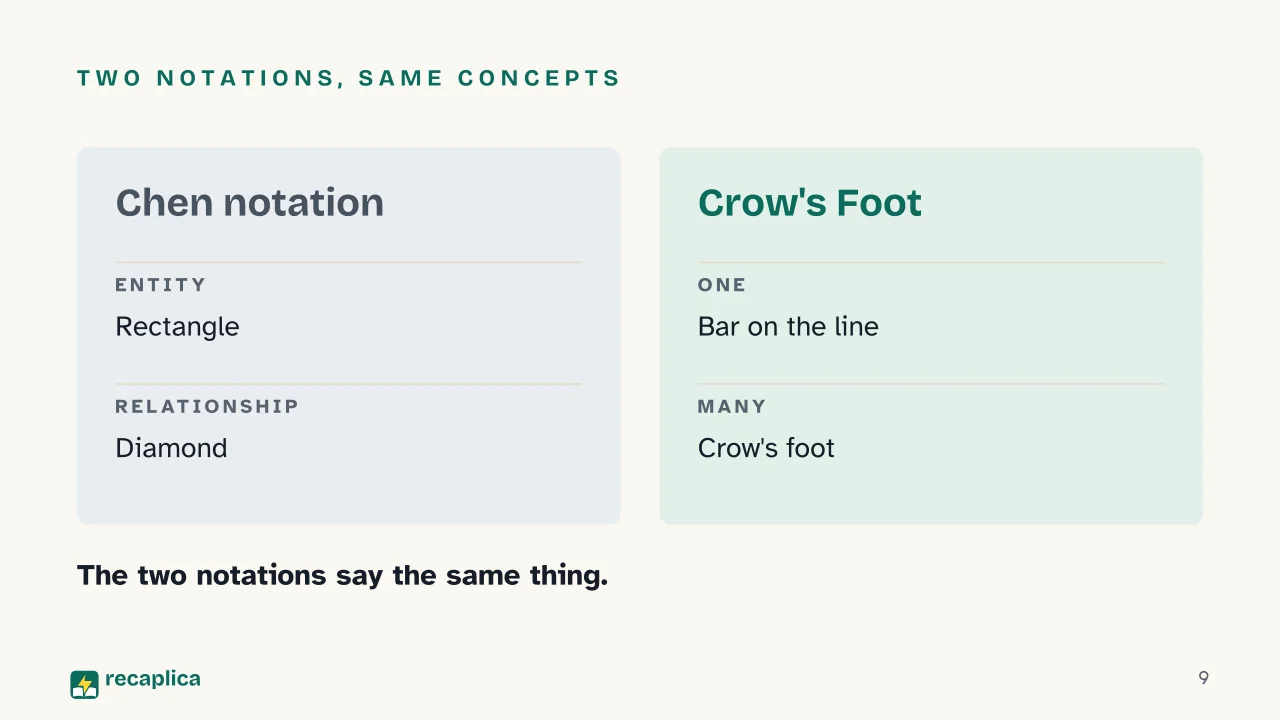 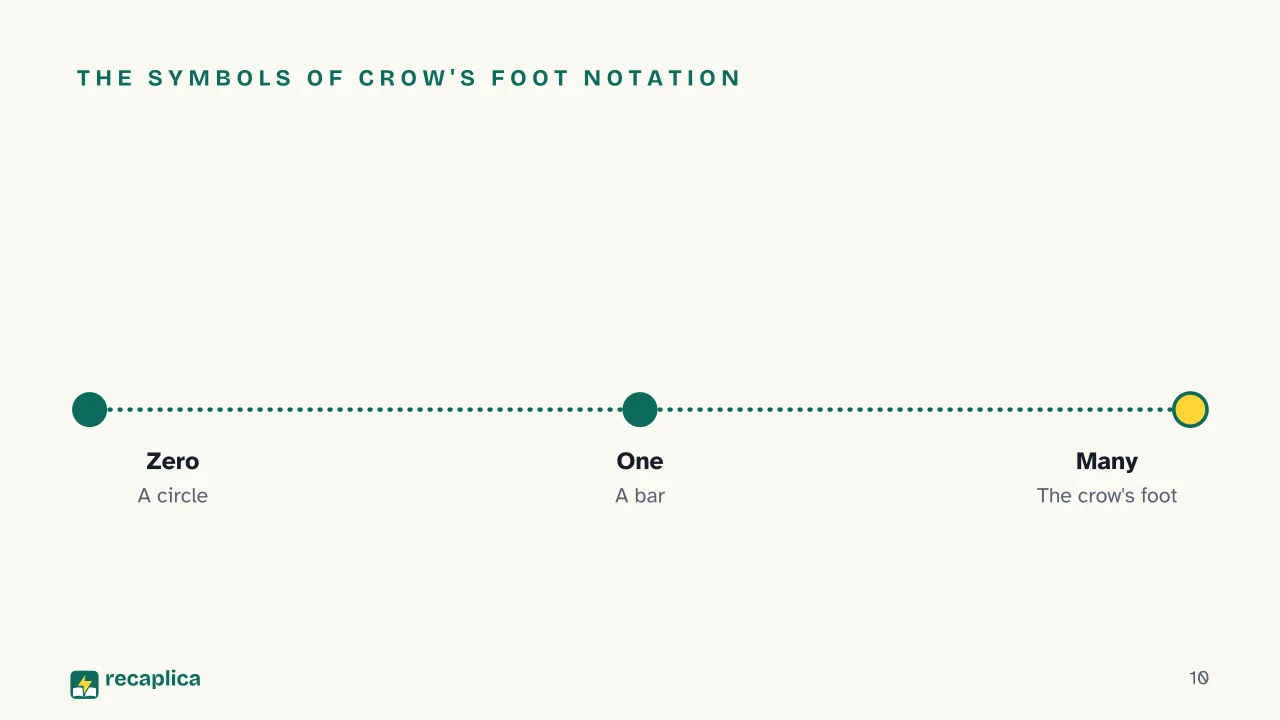  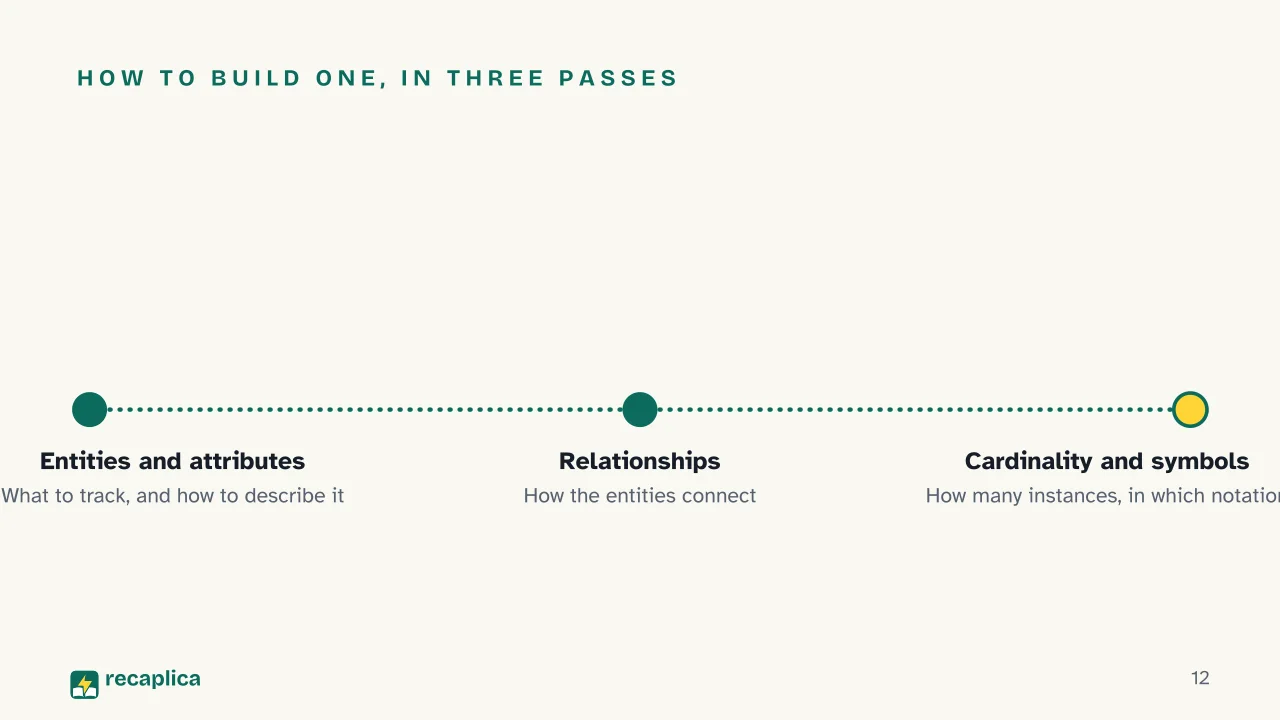 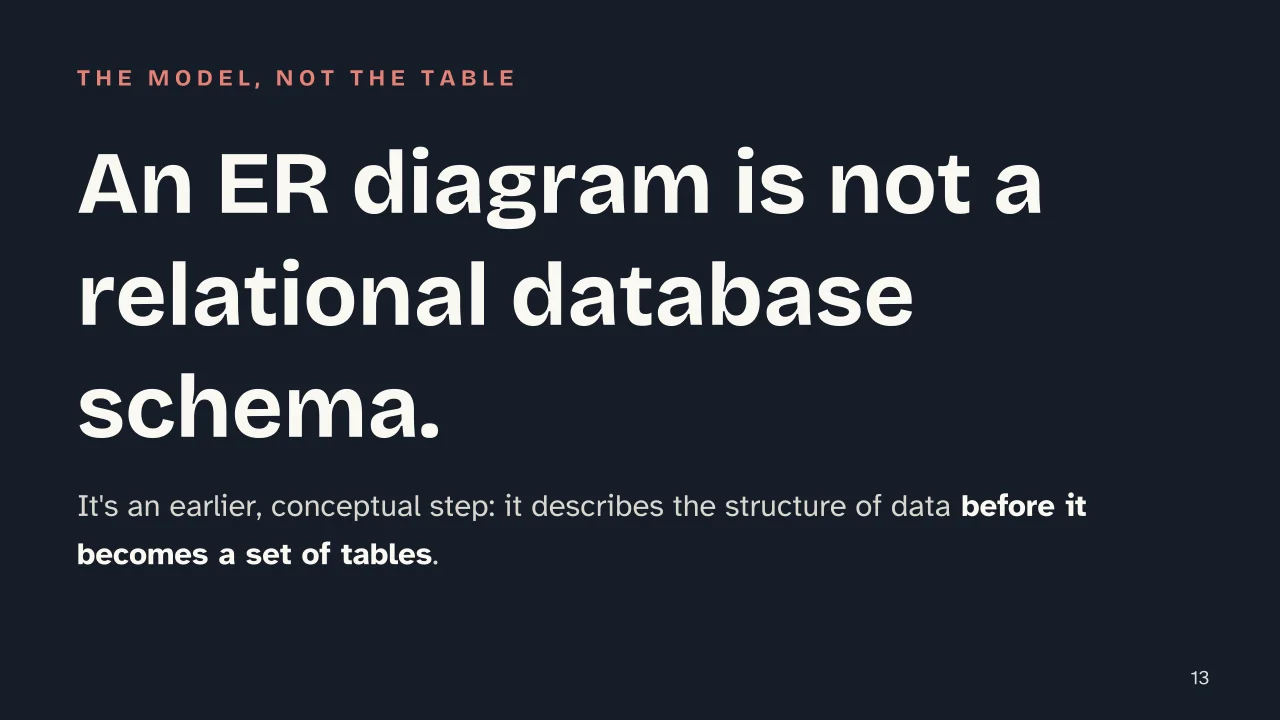 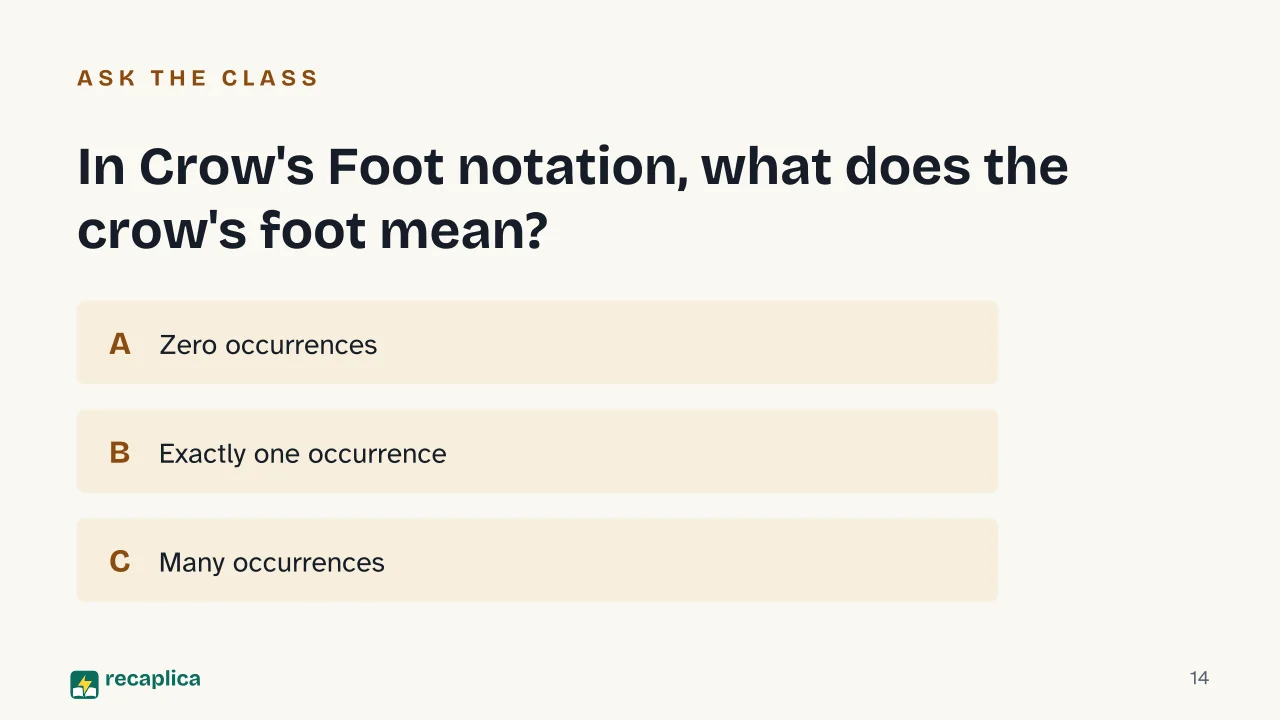  Common myths
Mind mapDrag the background to move around and the nodes to reposition them; use − and + to collapse and expand branches. 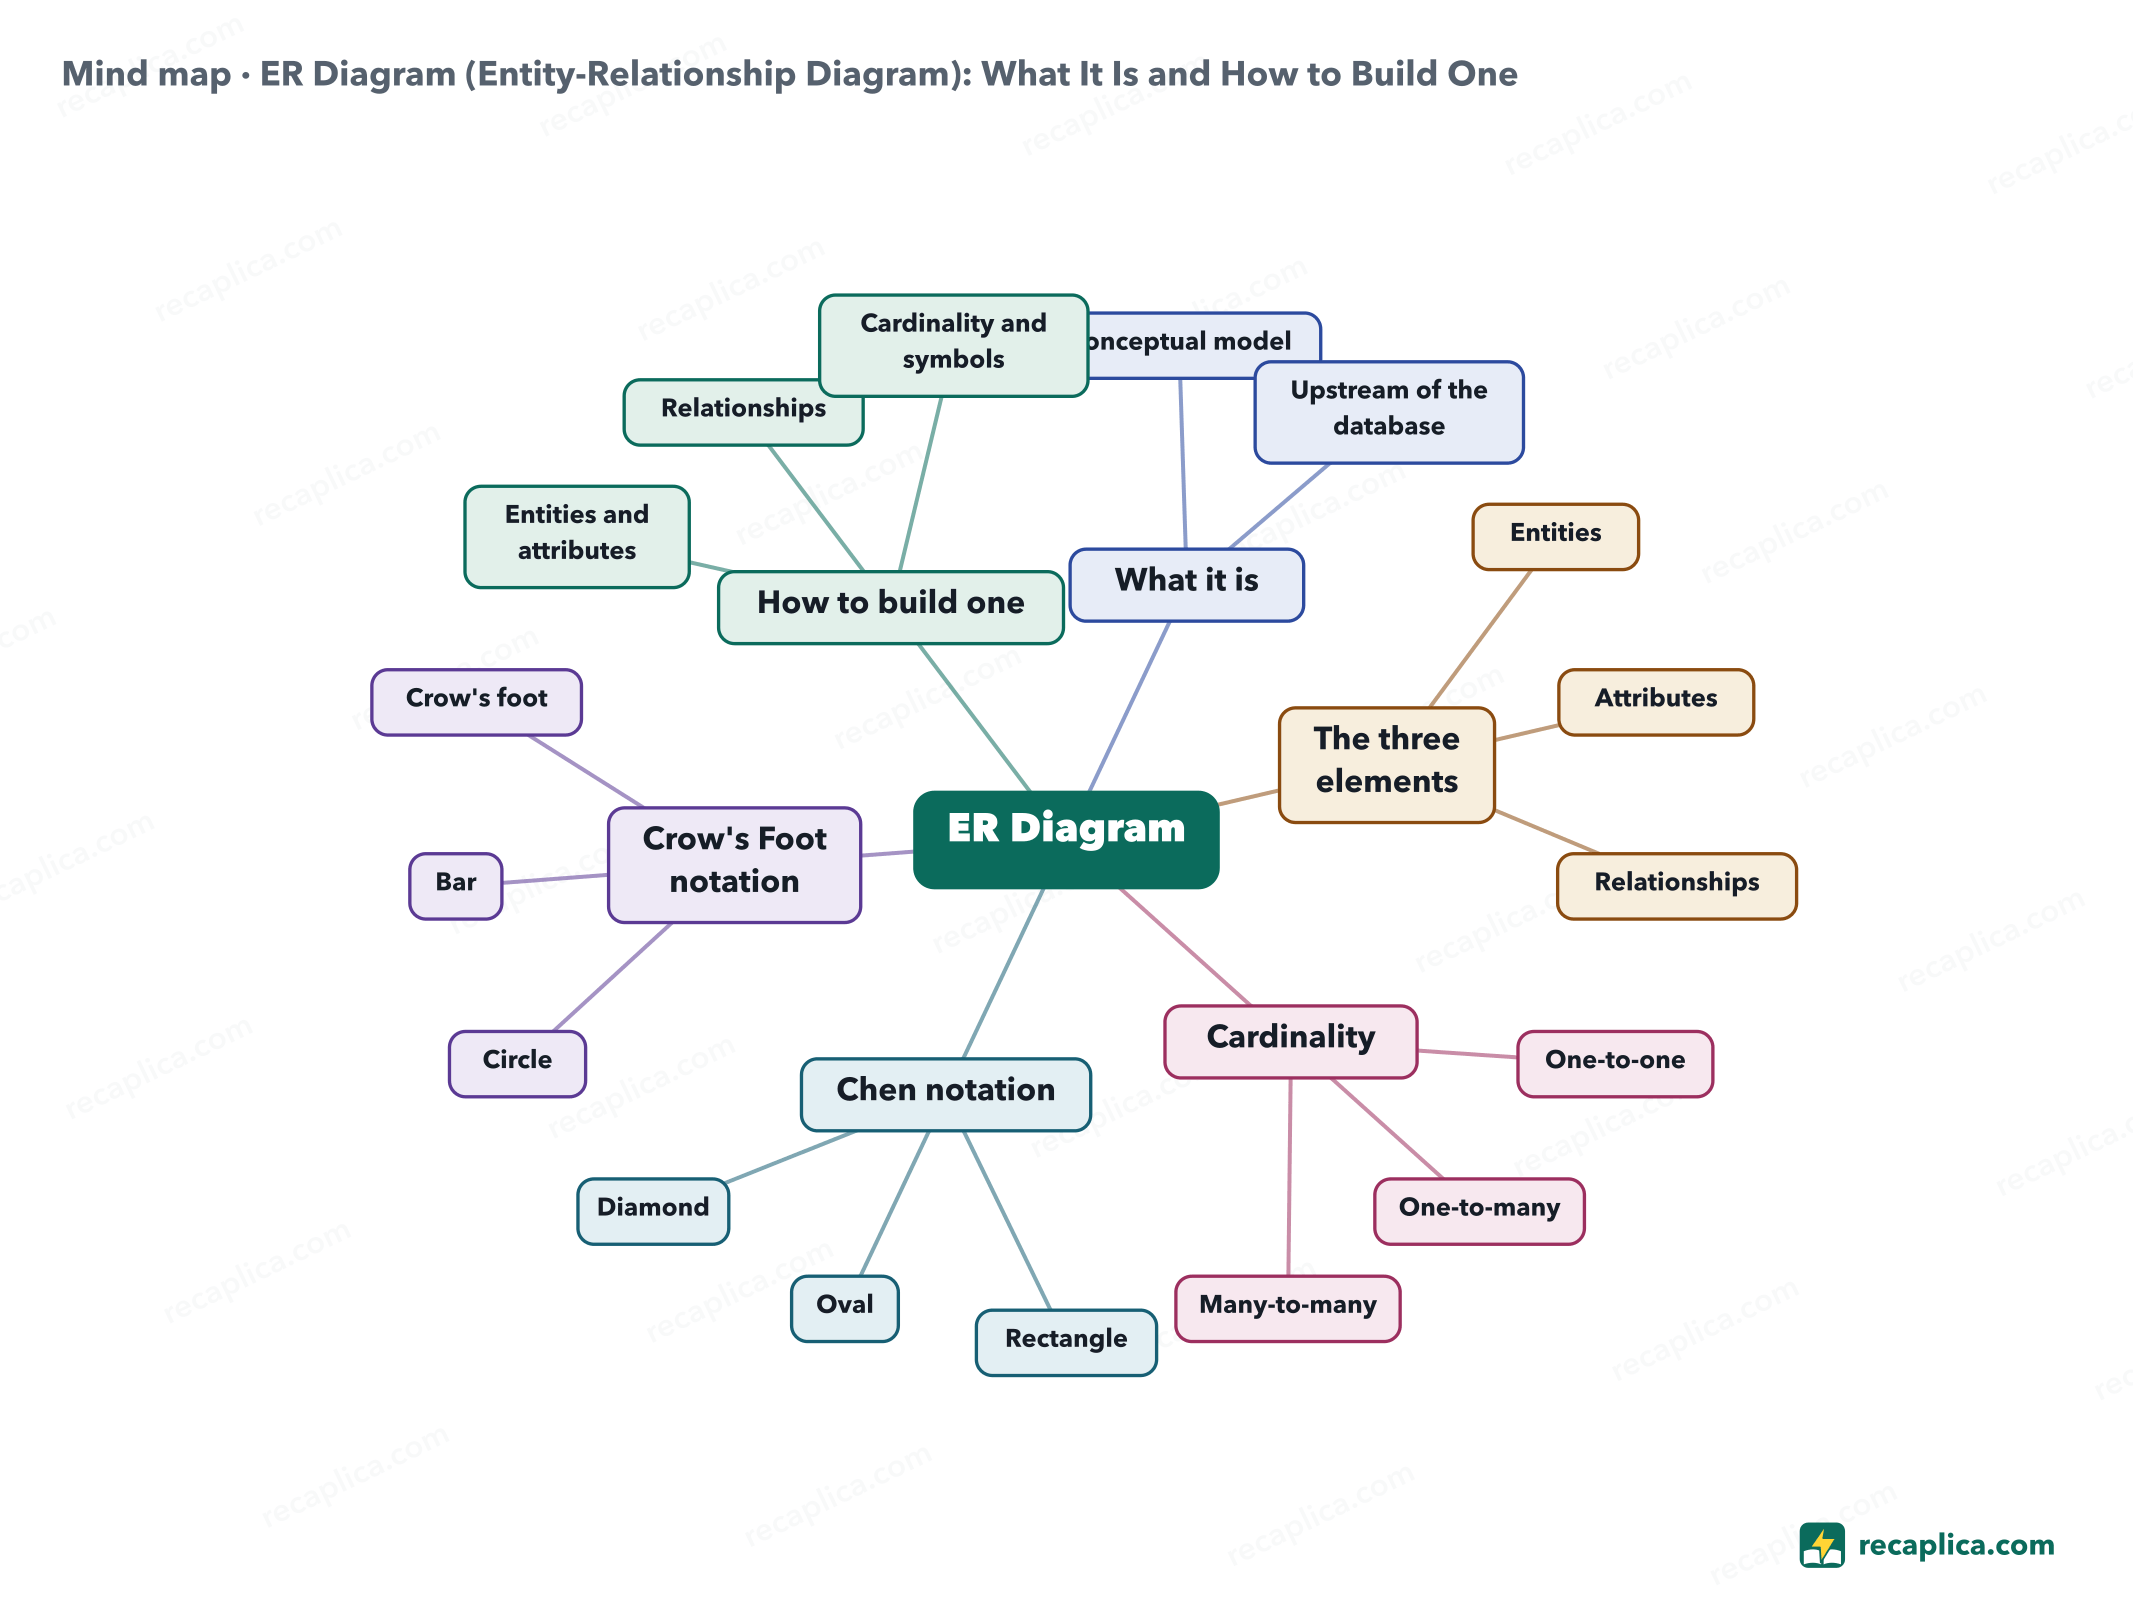
Quiz: test yourselfAnswer the questions to check what you have learned: you get instant feedback and a short explanation. Grade 0/10 0/5
FlashcardsTap the card to flip it and check whether you remember the answer, then move to the next one. 1 / 7 Explain it in your own wordsThe ultimate test: if you can explain it in simple words, you've truly understood it. Write your explanation, then compare it with the Recap. Your explanation is saved only on this device.
Frequently asked questionsWhat's the difference between an ER diagram and a relational database schema?An ER diagram works on the structure of data before any tables exist. The relational schema grows out of that model, with the adjustments it needs — for many-to-many relationships, for instance — to become something the database can actually use. What's the difference between Chen notation and Crow's Foot notation?They're two different ways of drawing the same concepts. Chen uses rectangles for entities, ovals for attributes and diamonds for relationships. Crow's Foot shows cardinality with lines ending in a circle (zero), a bar (one) or a crow's foot (many). What's an example of an entity-relationship diagram?A typical case is a university database with the entities Student, Course and Instructor: the Student has a StudentID, the Course has a CourseName, and a relationship connects the Student to the Course they enroll in, or the Instructor to the Course they teach. How do you draw a many-to-many relationship in an ER diagram?It's drawn as an ordinary relationship, for example between Employees and Projects (an employee works on several projects, a project has several employees), but converting it into a relational database takes more than one table: it needs an extra step to handle it. Every Recap goes through an independent review before publication. |