Skip to content
recaplica

    One moment: security check

    Cloudflare wants to make sure you're not a robot. Tick the box below and your search will continue on its own.

    IT
    recaplica How to Calculate Probability: The Basic Formulas and Where Intuition Gets It Wrong
    © 2026 Recaplica · recaplica.com — All rights reserved
    Home › Science

    How to Calculate Probability: The Basic Formulas and Where Intuition Gets It Wrong

    By Recaplica Newsroom · Updated on October 14, 2026

    What to print

    Page numbers appear when printing with default margins.

    Slides

    Choose a cut

    Flash10 slidesThe essential thread, to present in classFull15 slidesEvery chapter and the deeper detail

    Both come with speaker notes.

    Telegram channel
    recaplica Clear in 30 seconds, yours in 10 minutes.
    In 30 seconds Key points Deep dive Slides Myths Mind map Quiz Flashcards FAQ

    In 30 seconds quick read

    The classical probability of an event is found by dividing the number of favorable outcomes by the number of possible outcomes, as long as every outcome is equally likely. Relative frequency reaches the same number a different way, by counting how often an event actually happens over many trials. Roll a die or flip a coin enough times and the two approaches land on the same value. The arithmetic stays simple; what gets complicated is intuition, which veers off course in a few specific, predictable situations.

    Key Points

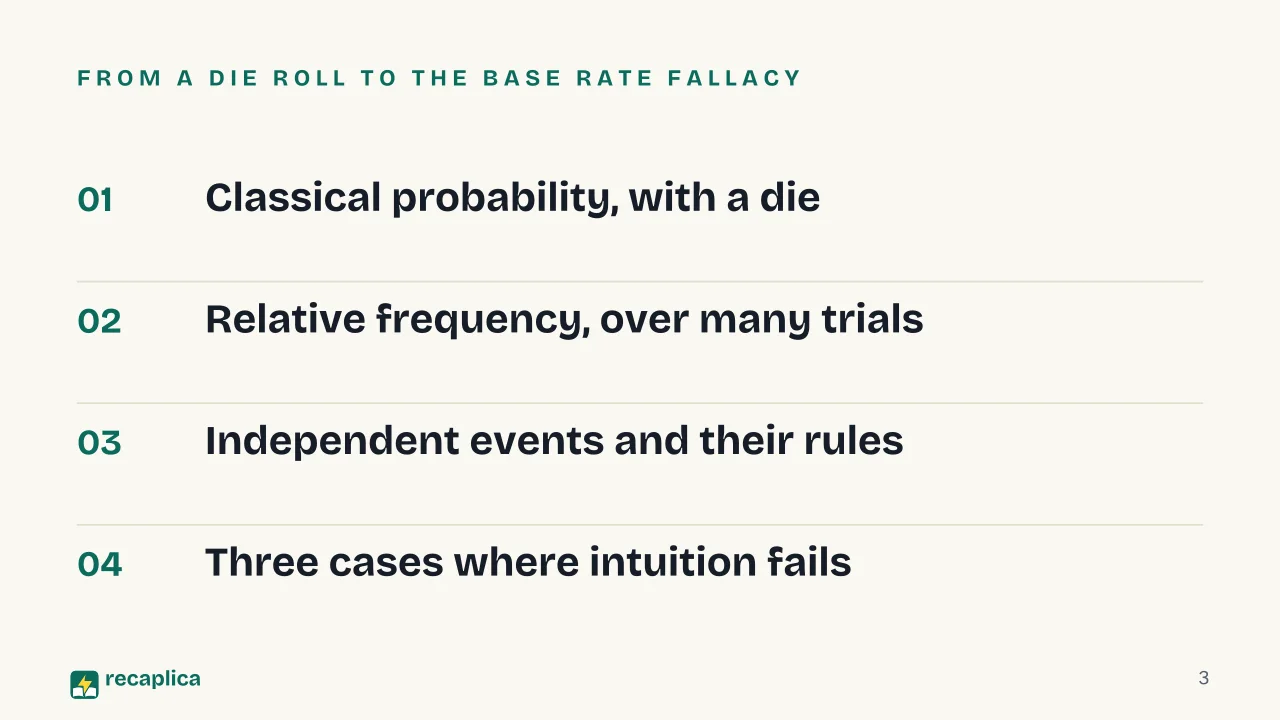
    • Classical probability: favorable outcomes divided by possible outcomes, when every outcome is equally likely.
    • Relative frequency: the observed frequency over many trials gets closer to the theoretical value as trials increase.
    • Independent events: the probability that both happen is the product of the individual probabilities, P(A)×P(B).
    • Gambler's fallacy: a fair coin has no memory of previous flips, even after a long run of the same result.
    • Birthday problem: with 23 people, the probability of a shared birthday already passes 50%, because the count is over every possible pair.
    • Base rate fallacy: a stereotyped description can make people forget the real proportions of the group it came from.

    Deep Dive

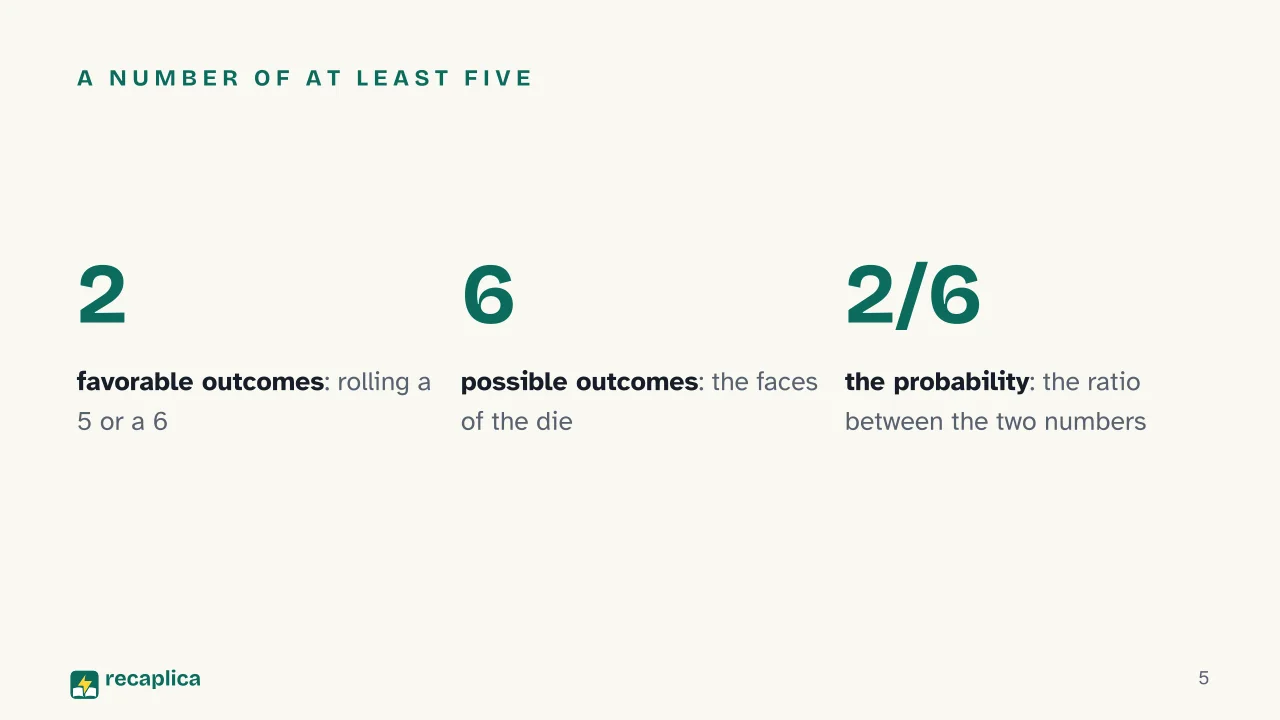
    Working out a probability, in the simplest case, means counting two numbers and turning them into a ratio. OpenStax, in its introductory statistics textbook, defines the classical probability of an event as the ratio between the number of favorable outcomes and the total number of possible outcomes, provided every outcome in the sample space is equally likely. With a fair six-sided die, the probability of rolling a number of at least five is 2/6: the favorable outcomes are two, the 5 and the 6, out of six possible in total.

    The classical probability formula

    The classical calculation doesn’t need a single roll: it only needs counting. There is one condition to check first, though, true for a fair die but not for every situation: each possible outcome must be exactly as likely as the others. When that condition holds, the formula is:

    ElementIn the die example
    Favorable outcomes2 (the 5 and the 6)
    Possible outcomes6 (the faces of the die)
    Probability2/6

    Worked example: rolling a fair die, the probability of an even number (2, 4, or 6) follows the same formula: three favorable outcomes out of six possible, so 3/6.

    This is also how to find probability in any situation with a finite, equally likely set of outcomes — count what counts as a win, count everything that could happen, and divide.

    Relative frequency and the law of large numbers

    There’s another route to the same number, one that goes through observation instead of counting on paper. Relative frequency is the proportion of times an event actually occurs over a large number of repeated trials. OpenStax connects the two definitions by showing that, rolling a die many times in practice, the observed frequency of “a number of at least five” gets closer to the theoretical 2/6 value worked out with classical probability. For a broader look at how single ratios like this one fit into collecting and summarizing data, probability and statistics is a useful starting point.

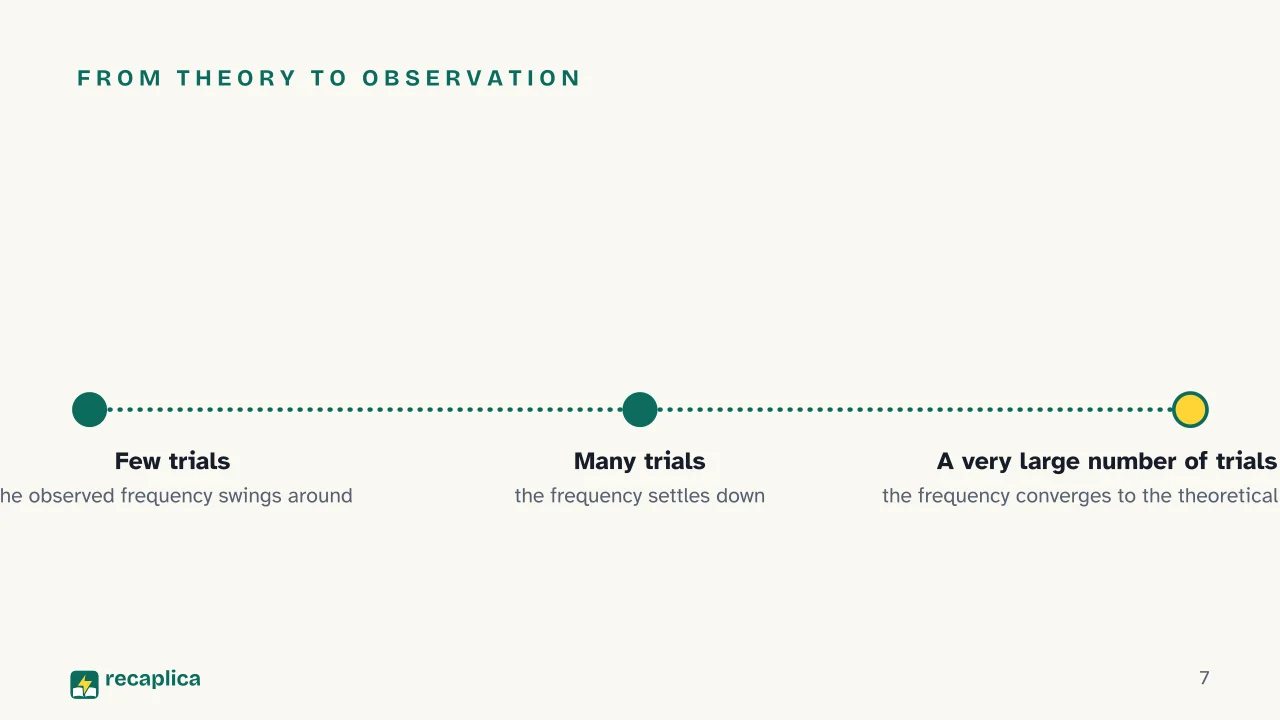
    The law of large numbers, as the textbook presents it, says that the more times an experiment gets repeated, the closer the observed relative frequency gets to the theoretical probability calculated beforehand. With few trials, the frequency bounces around quite a bit; with many trials, it settles down. The two definitions of probability — classical, worked out ahead of time, and relative frequency, observed in the field — converge on the same value as trials pile up.

    Independent events: the multiplication and addition rules

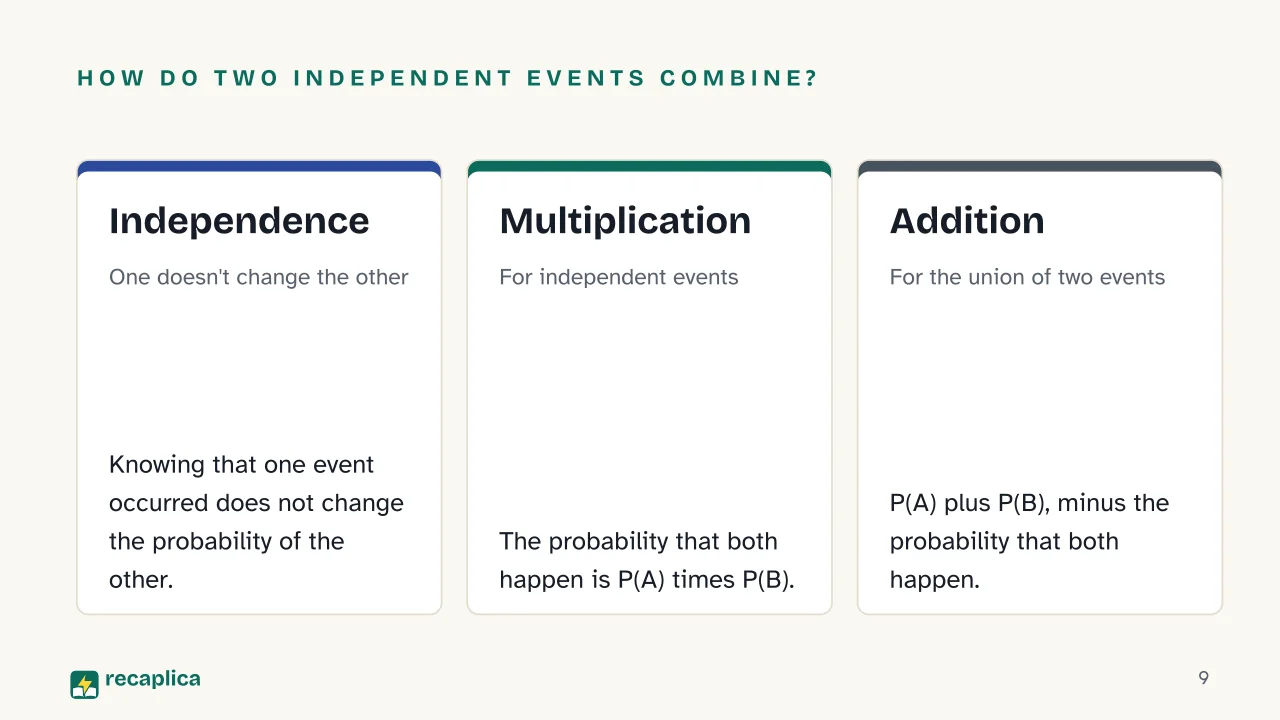
    Two events are independent when knowing that one of them occurred doesn’t change the probability that the other occurs. OpenStax formalizes independence with three equivalent conditions, including the multiplication rule: the probability that both events A and B occur is the product of their individual probabilities, P(A)×P(B).

    In the textbook’s example, with P(G)=0.6, P(H)=0.5, and P(G and H)=0.3, the product of the two individual probabilities (0.6×0.5=0.3) matches the probability of the intersection — confirming that events G and H are independent.

    When what’s needed instead is the probability that at least one of the two events occurs, the addition rule comes in. OpenStax states it as the sum of the individual probabilities minus the probability of their intersection, P(A)+P(B)−P(A and B): the subtraction keeps the cases where both events happen together from being counted twice.

    The gambler’s fallacy: when the past doesn’t count, but feels like it does

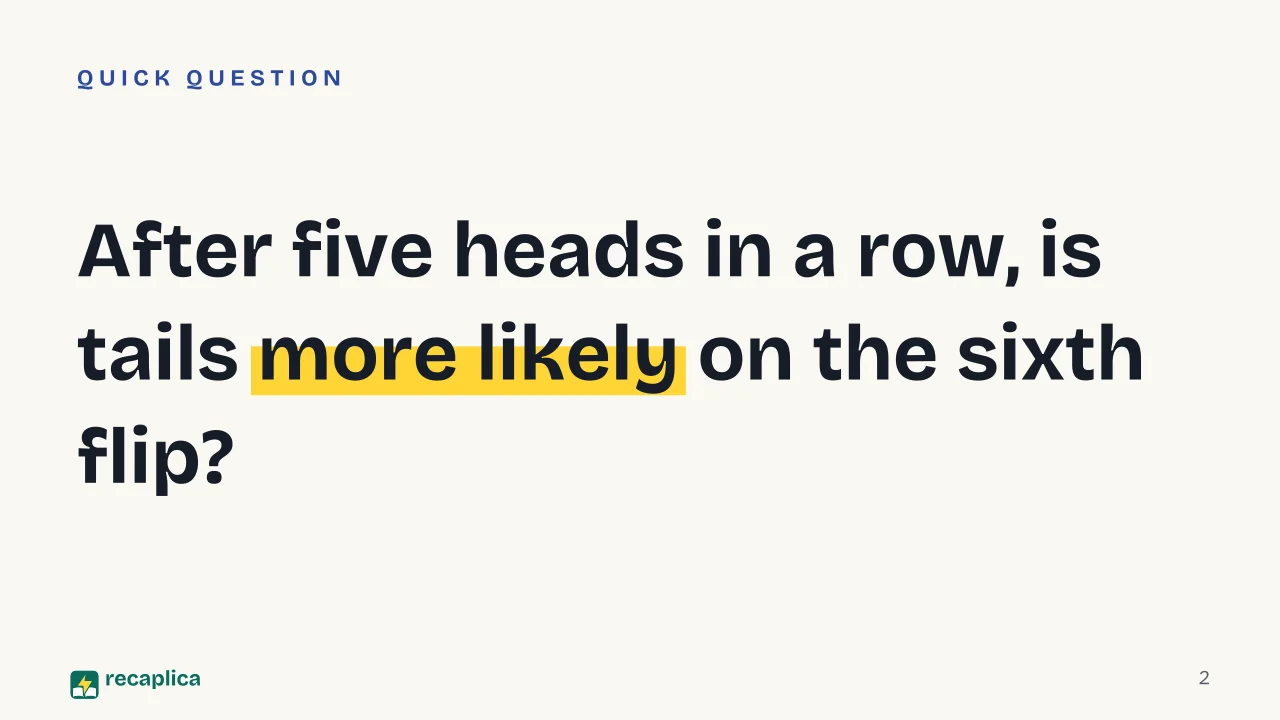
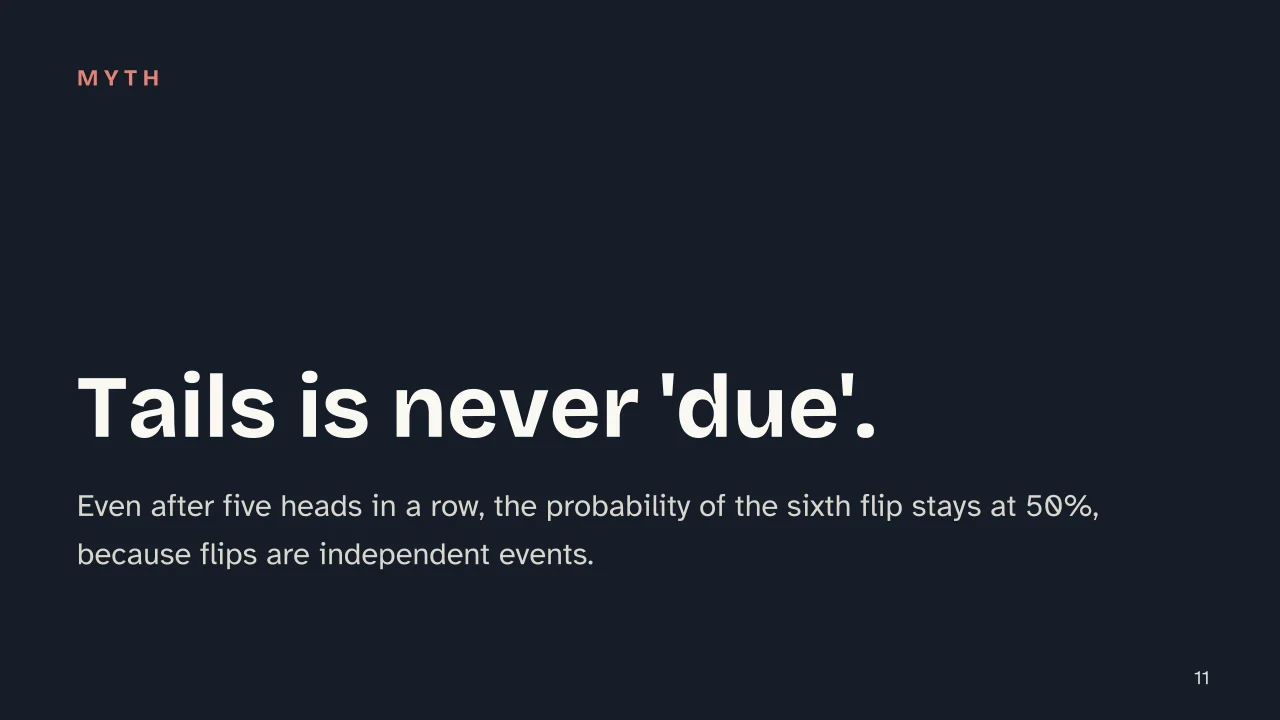
    Someone who flips a fair coin and gets heads five times in a row often expects tails to be “more likely” on the sixth flip. According to OnlineStatBook, this error comes from believing that the outcome of an event independent of the past is influenced by earlier results in the same sequence — the gambler’s fallacy. In reality, even after five consecutive heads, the probability that the next flip comes up tails stays at 50%, because flips are independent events and there’s no quota a result has to fill.

    The source uses a two-flip case to show it plainly: the outcome of the first flip doesn’t change the probability of the second one at all. A run of five heads leaves no trace on the coin; the coin isn’t keeping score.

    The birthday problem: why a single classroom is enough

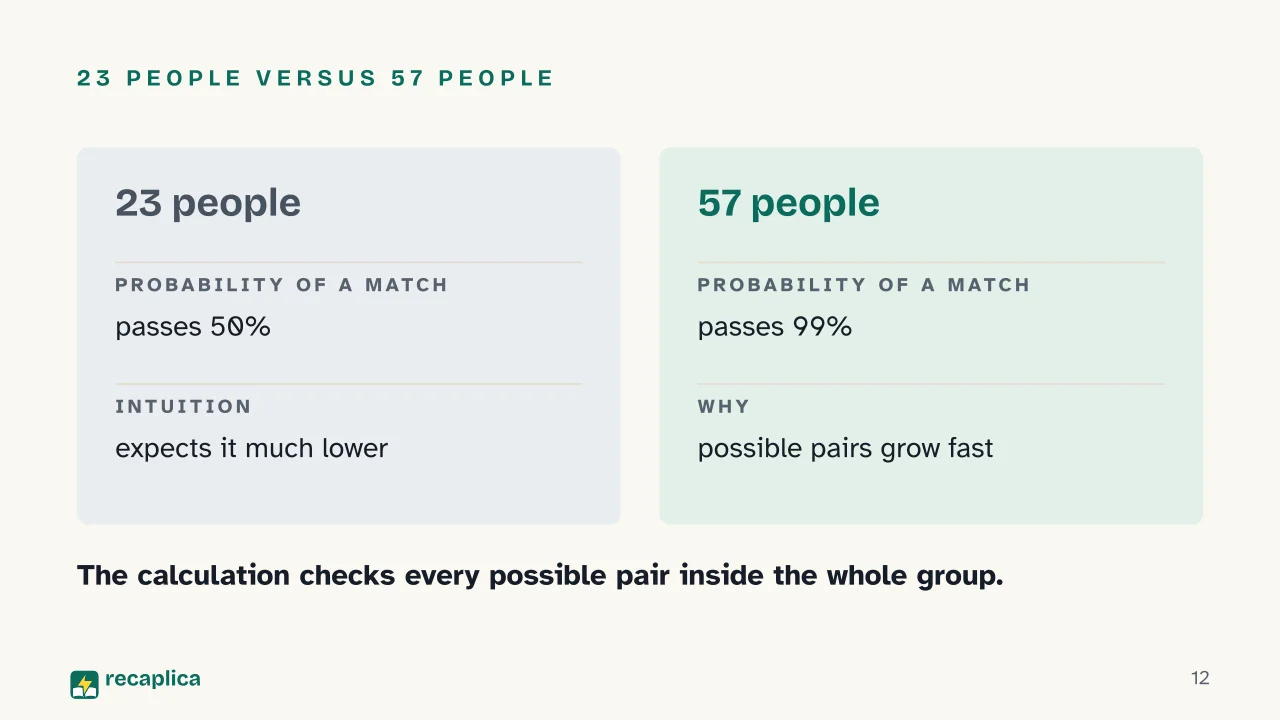
    The birthday problem shows the same intuition missing the mark on the low side. Harvey Mudd College lays it out this way: with 23 people in a room, the probability that at least two of them share a birthday already passes 50%. The proof first works out the probability that all 23 people have different birthdays, multiplying the shrinking probabilities that each new person added doesn’t repeat a day already taken by the others, then gets the probability of at least one match by subtracting that value from 1. With 23 people, this probability already passes 50%. With 57 people, Harvey Mudd College reports that the probability of at least one shared birthday climbs past 99%.

    Picturing the wrong comparison is what throws people off: one person against the other 22, a matchup that would leave little room for a coincidence. The real count runs over every possible pair inside the group: with 23 people, the number of pairs to check is already large, far larger than 23 itself. The more pairs get checked, the higher the chance that at least one of them matches.

    Base rate fallacy: when the description beats the numbers

    The third case is about how new information gets combined with starting proportions. A study published on PubMed Central defines the base rate fallacy, or base rate neglect, as people’s tendency to not properly combine prior probabilities — the base rate of an event in a population — with new information received, the way Bayes’ theorem would require.

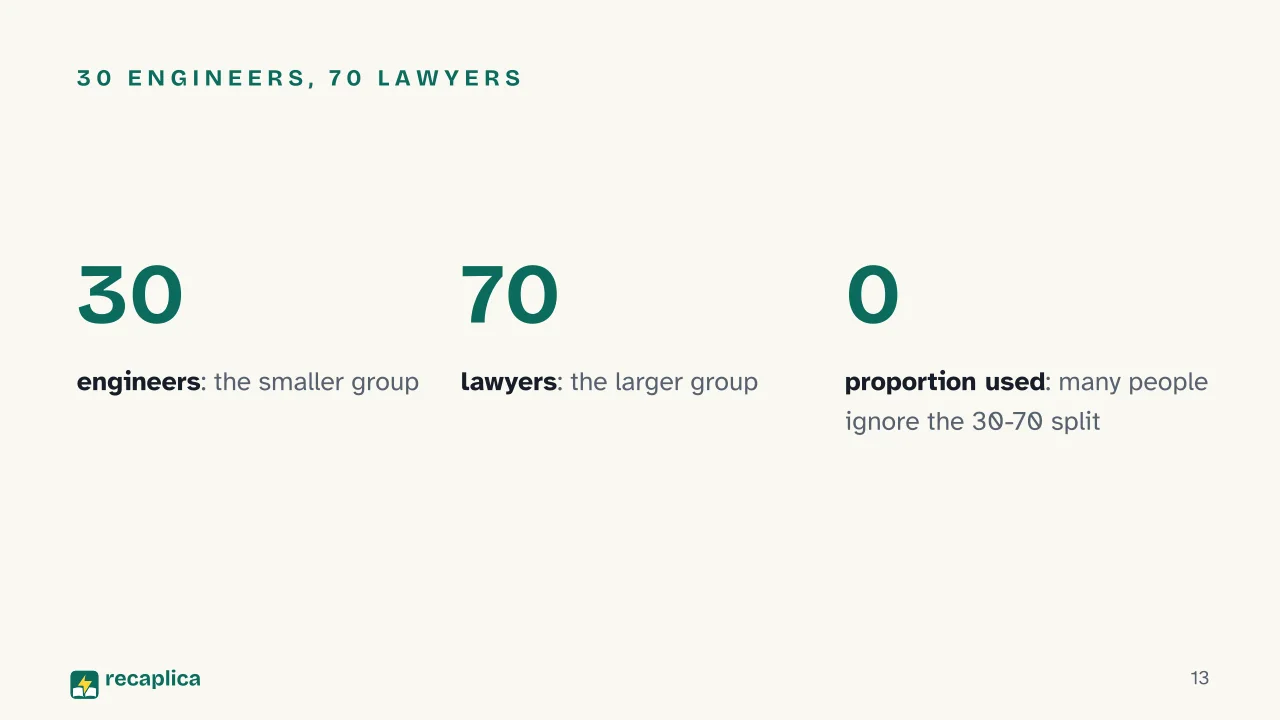
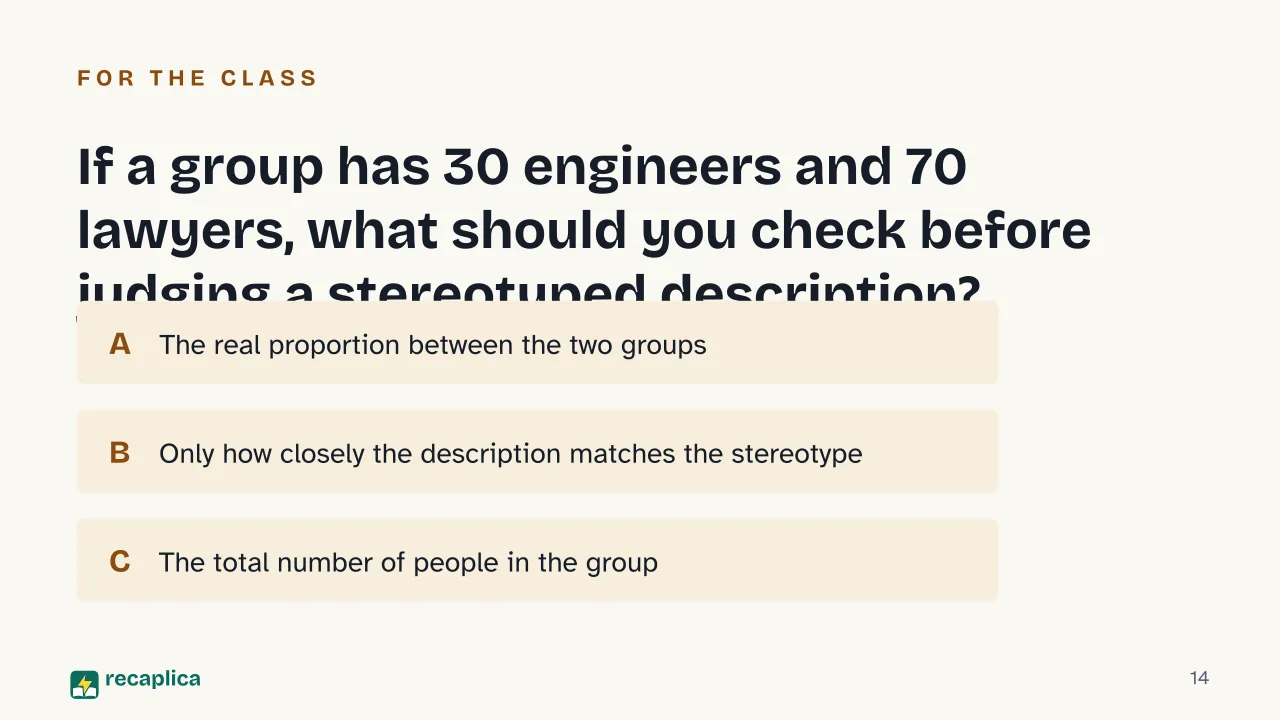
    The classic problem used to measure this error, drawn from Kahneman and Tversky’s experiment and reported in that PubMed Central study, describes a person picked at random from a group made up of, say, 30 engineers and 70 lawyers: the description matches the stereotype of the smaller group, the engineers. Participants in the experiment tend to ignore the 30-against-70 split and judge only from how closely the description fits the stereotype — the same snap judgment that stereotypes and prejudice produce far beyond a probability classroom.

    Worked example: in a group of 30 engineers and 70 lawyers, even a description that sounds “like an engineer” still leaves it more likely, by sheer proportion, that the person picked at random is a lawyer — unless the description is specific enough to outweigh that starting split.

    The underlying habit in all three cases is the same one at the heart of the scientific method: check a claim against numbers gathered beforehand instead of trusting whichever story feels most convincing in the moment.

    Slide deck

    Slides ready to download and make your own in PowerPoint or Google Slides, with speaker notes. Pick the Flash cut or the Full one.
    Slide 1 of the presentation on How to Calculate Probability: How to Calculate ProbabilitySlide 2 of the presentation on How to Calculate Probability: After five heads in a row, is tails more likely on the sixth flip?Slide 3 of the presentation on How to Calculate Probability: From a die roll to the base rate fallacySlide 4 of the presentation on How to Calculate Probability: Chapter 01: Classical probabilitySlide 5 of the presentation on How to Calculate Probability: A number of at least fiveSlide 6 of the presentation on How to Calculate Probability: Chapter 02: Relative frequencySlide 7 of the presentation on How to Calculate Probability: From theory to observationSlide 8 of the presentation on How to Calculate Probability: Chapter 03: Independent eventsSlide 9 of the presentation on How to Calculate Probability: How do two independent events combine?: Independence, Multiplication, AdditionSlide 10 of the presentation on How to Calculate Probability: Chapter 04: Where intuition misleadsSlide 11 of the presentation on How to Calculate Probability: Tails is never 'due'.Slide 12 of the presentation on How to Calculate Probability: 23 people versus 57 peopleSlide 13 of the presentation on How to Calculate Probability: 30 engineers, 70 lawyersSlide 14 of the presentation on How to Calculate Probability: If a group has 30 engineers and 70 lawyers, what should you check before judging a stereotyped description?Slide 15 of the presentation on How to Calculate Probability: Time to review
    Flash10 slidesThe essential thread, to present in classFull15 slidesEvery chapter and the deeper detail

    Common myths

    • ✗ Myth After a long streak of heads, tails is more likely on the next flip, almost 'overdue'.

      ✓ Reality Many people believe a long run of one result pulls the other result closer, but a fair coin has no memory: each flip is independent of the ones before it, so the probability of tails always stays at 50%, because there's no quota a result has to meet.

    • ✗ Myth If a description matches a group's stereotype, the person described almost certainly belongs to that group.

      ✓ Reality Many people think a resemblance to the stereotype is enough to decide, but the size of each starting group matters too: if the group that matches the stereotype is a small minority, the real proportion can outweigh the description, and that proportion is exactly what intuition tends to ignore.

    Mind map

    Drag the background to move around and the nodes to reposition them; use − and + to collapse and expand branches.
    Customize
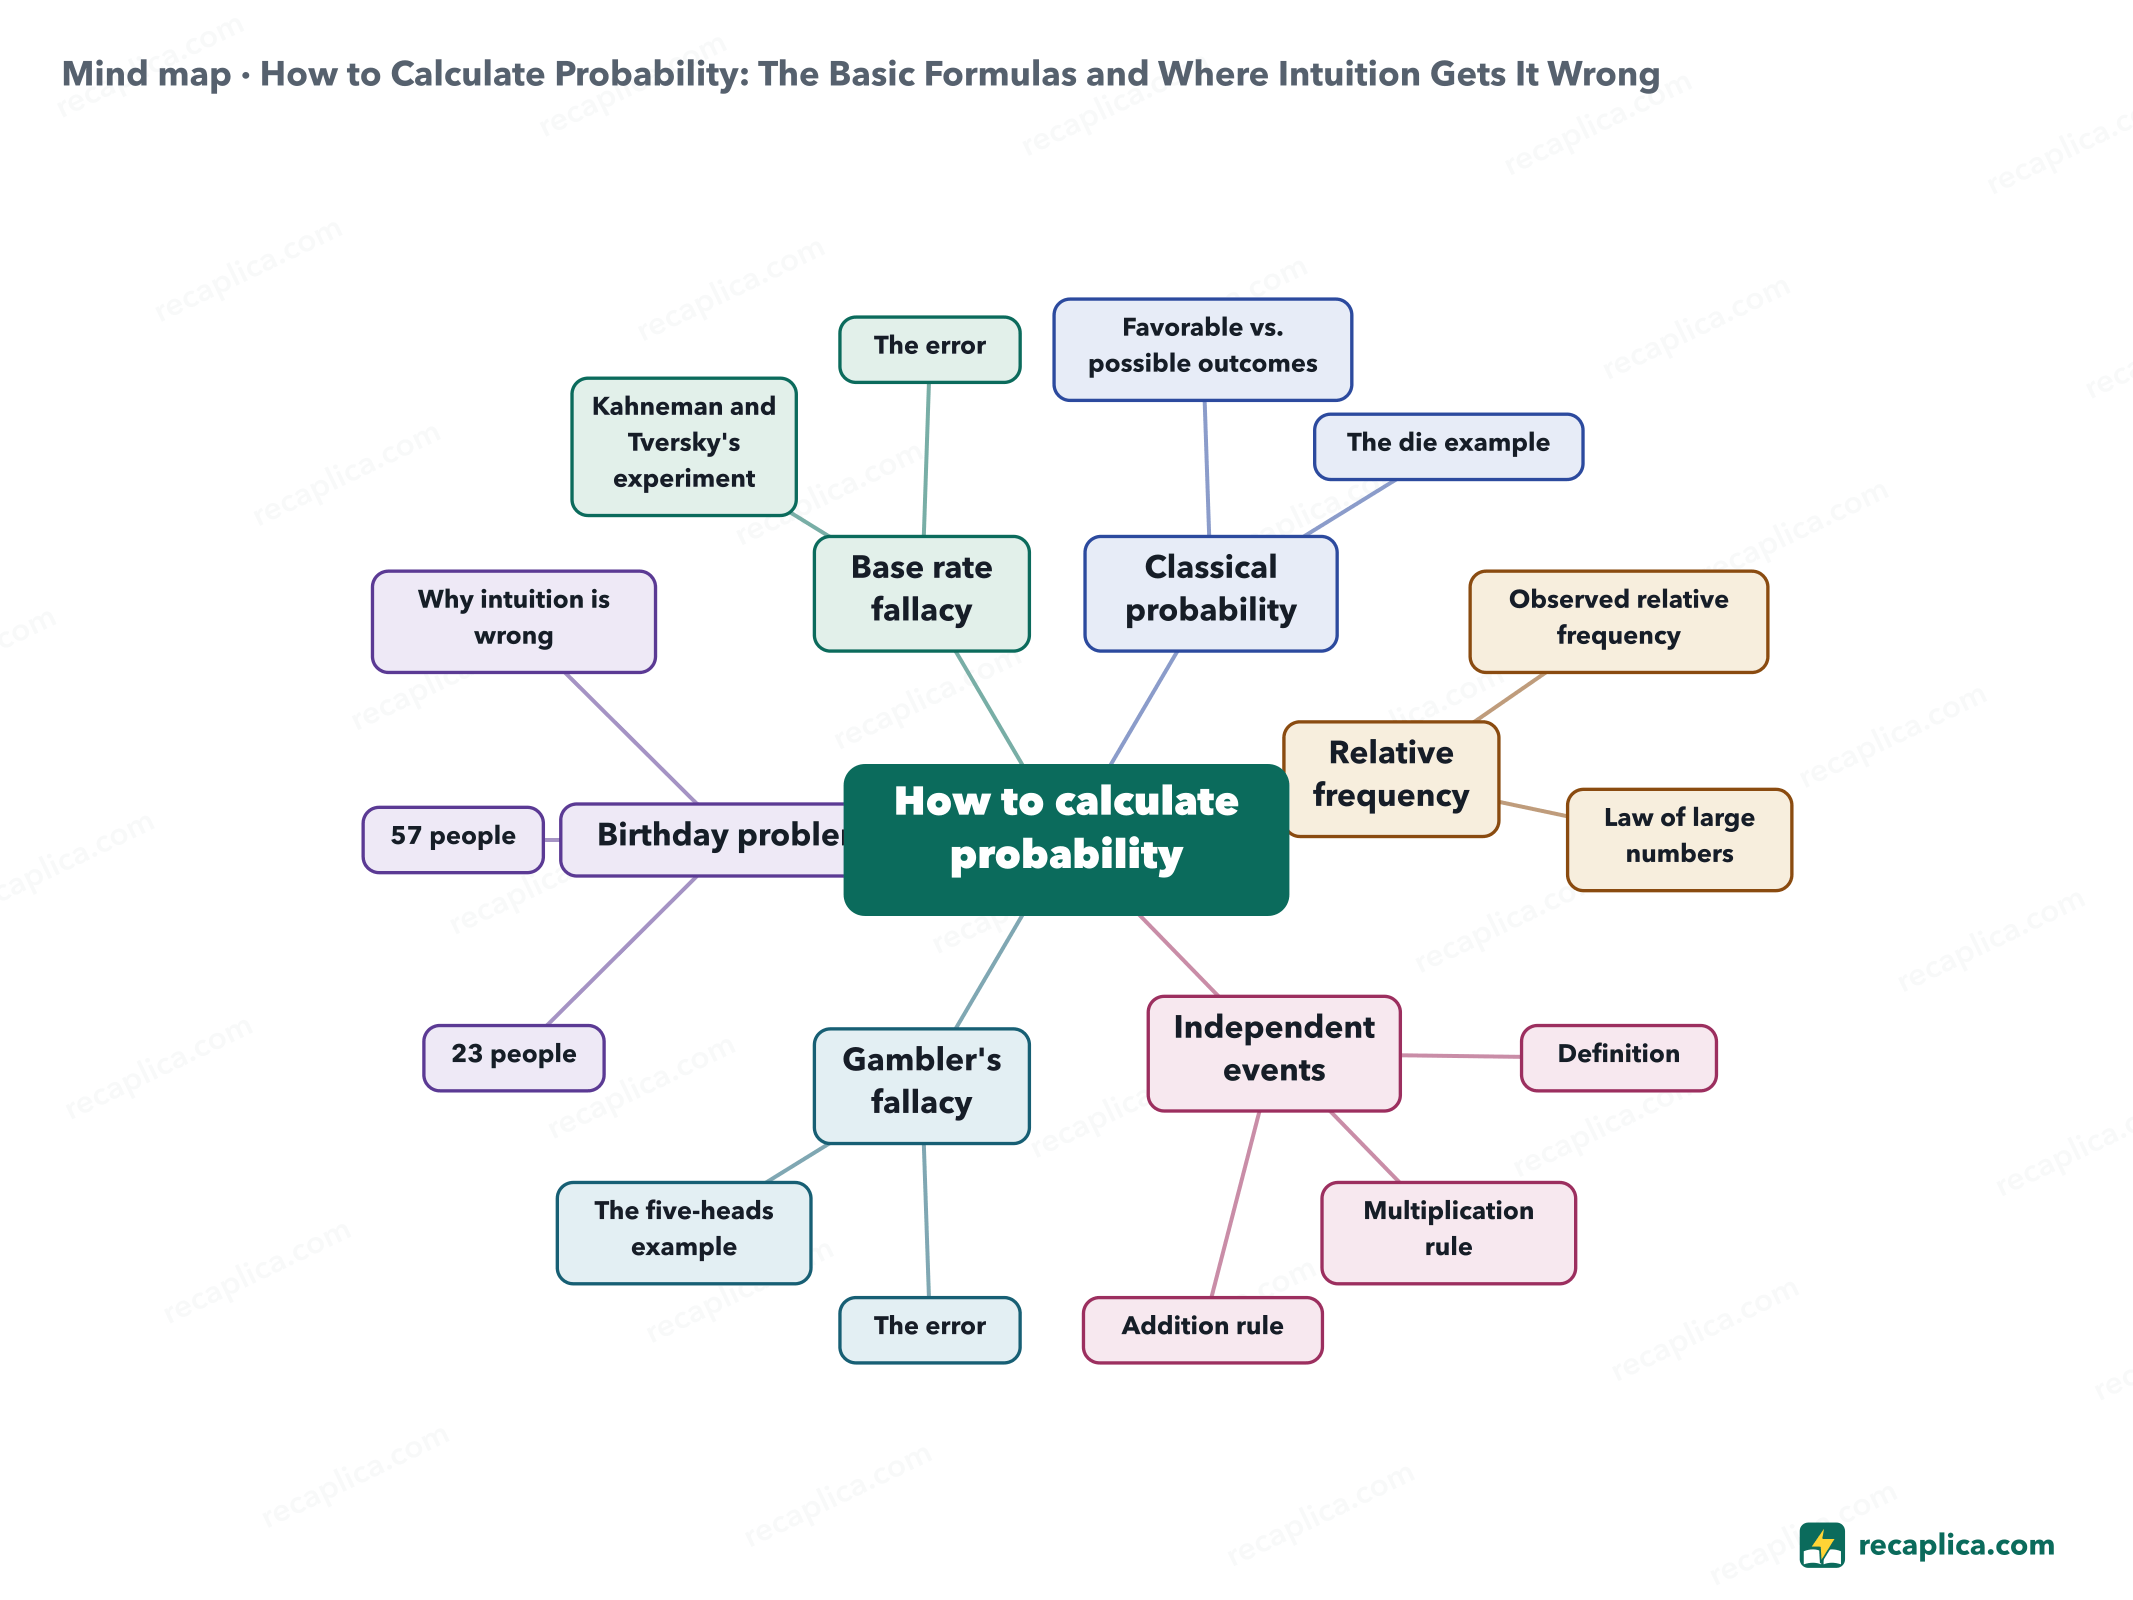
    Mind map: How to Calculate Probability: The Basic Formulas and Where Intuition Gets It Wrong
    • How to calculate probability
      • Classical probability
        • Favorable vs. possible outcomes The ratio that defines probability, when outcomes are equally likely
        • The die example A number of at least five, 2 outcomes out of 6
      • Relative frequency
        • Observed relative frequency
        • Law of large numbers Frequency converges to the theoretical value over many trials
      • Independent events
        • Definition One event occurring doesn't change the other's probability
        • Multiplication rule P(A and B) = P(A) × P(B)
        • Addition rule P(A or B) = P(A) + P(B) − P(A and B)
      • Gambler's fallacy
        • The error Believing the past affects an independent event
        • The five-heads example The probability of tails stays at 50%
      • Birthday problem
        • 23 people The probability of a match passes 50%
        • 57 people The probability passes 99%
        • Why intuition is wrong The comparison covers every possible pair in the group
      • Base rate fallacy
        • Kahneman and Tversky's experiment Engineers and lawyers, 30 against 70
        • The error A stereotyped description outweighs the real proportion

    Quiz: test yourself

    Answer the questions to check what you have learned: you get instant feedback and a short explanation.

    Grade 0/10 0/5
    1 Rolling a fair six-sided die, what is the probability of getting a number of at least five?

    The favorable outcomes are two (5 and 6) out of six possible, so the classical probability is 2/6.

    2 What does the law of large numbers say?

    As repetitions increase, the observed frequency converges toward the theoretical value calculated in advance with classical probability.

    3 If two events A and B are independent, how do you find the probability that both occur?

    The multiplication rule for independent events says that P(A and B) is the product of the individual probabilities.

    4 After five straight heads on a fair coin, what is the probability that the sixth flip comes up tails?

    Flips are independent events: the sixth flip's outcome does not depend in any way on the previous five. Believing otherwise is the gambler's fallacy.

    5 Why does the probability of a shared birthday among 23 people already pass 50%, against the intuition that it should be much lower?

    The number of possible pairs grows much faster than the number of people: with 23 people there are already hundreds of pairs to check.

    Answers: 1-A · 2-A · 3-A · 4-A · 5-A

    Flashcards

    Tap the card to flip it and check whether you remember the answer, then move to the next one.

    1 / 8

    Explain it in your own words

    The ultimate test: if you can explain it in simple words, you've truly understood it. Write your explanation, then compare it with the Recap.

    Your explanation is saved only on this device.

    The classical probability of an event is found by dividing the number of favorable outcomes by the number of possible outcomes, as long as every outcome is equally likely. Relative frequency reaches the same number a different way, by counting how often an event actually happens over many trials. Roll a die or flip a coin enough times and the two approaches land on the same value. The arithmetic stays simple; what gets complicated is intuition, which veers off course in a few specific, predictable situations.

    Frequently asked questions

    How do you calculate the probability of an event?

    In the classical case, you count how many outcomes count as a win and compare that against everything that could happen, as long as each outcome is just as likely as the rest. With a fair die, the probability of a number of at least five is 2/6, because the favorable outcomes (5 and 6) are two out of six.

    How do you find probability using relative frequency instead?

    Classical probability is worked out in advance, by counting favorable and possible outcomes. Relative frequency is observed by repeating the experiment many times and tracking how often the event happens: with enough trials, that frequency approaches the theoretical value from classical probability.

    What is the birthday problem?

    It's the fact that a group of just 23 people is enough to pass a 50% probability that two of them share a birthday, and with 57 people the probability passes 99%. Intuition underestimates it because it pictures one person compared with everyone else, while the calculation compares every possible pair in the group.

    Why do people expect tails after several heads in a row?

    It's a judgment error called the gambler's fallacy: a fair coin has no memory of previous flips, so the probability of tails stays at 50% even after five consecutive heads.

    What does the engineer-and-lawyer example teach about the base rate fallacy?

    That a stereotyped description can make people ignore the real proportions of the group: in a group of 30 engineers and 70 lawyers, a description that fits the engineer stereotype pushes many people to weigh the description more heavily than the 30/70 split the person was actually drawn from.

    Sources

    • OpenStax, Introductory Statistics 2e — 3.1 Terminology
    • OpenStax, Introductory Statistics 2e — 3.2 Independent and Mutually Exclusive Events
    • OpenStax, Introductory Statistics 2e — 3.3 Two Basic Rules of Probability
    • OnlineStatBook (Rice University), Gambler's Fallacy
    • Harvey Mudd College, Fun Facts — Birthday Problem
    • PubMed Central, When Cognitive Reflection Leads to Less Overall but More Systematic Judgment Bias: The Case of the Base Rates Fallacy

    Every Recap goes through an independent review before publication.

    Every evening, the day's new Recaps on our Telegram channel. Join the channel →

    Keep learning

    • Science Correlation: What It Means and How to Read the Coefficient Correlation measures how closely two variables move together, and the most common way to put a number on it is the correlation coefficient, which runs from -1 to +1. A value near +1 means the two variables rise together, near -1 means one rises while the other falls, and near 0 means no linear relationship stands out. The coefficient only captures the strength of a straight-line relationship, and a single unusual data point can push it up or down by a lot. Even when it's strong, a correlation between two variables never shows that one causes the other. Read the Recap →
    • Science Light Refraction: What It Is, the Laws Behind It, and Examples A surface that separates two transparent materials sends some light back, reflecting it, and lets the rest through while bending it toward a new direction. The law of reflection keeps the incoming and outgoing angles equal, both measured from the normal to the surface. Snell's law governs refraction instead, linking the index of each material to how much the ray tilts before and after it crosses over. These two laws alone explain mirrors, lenses, prisms and everyday sights such as a pencil that appears to snap inside a glass of water. Read the Recap →
    • Science Total Internal Reflection and the Critical Angle: Definition and Formula Total internal reflection is what happens when a light ray stops being able to leave a transparent medium and gets sent back inside it completely. It takes place past a specific angle of incidence, called the critical angle, calculated with Snell's law by comparing the refractive indices of the two materials involved. It only happens under one precise condition: the ray must be traveling from an optically denser medium into a less dense one, such as from water into air or from glass into air. Optical fibers and, in part, the sparkle of diamonds rely on this same principle. Read the Recap →

    recaplica

    Clear in 30 seconds, yours in 10 minutes.

    Recaps Mind maps Request a Recap Telegram channel Mind map maker Our method About Privacy & cookies Legal notes & terms of use

    © 2026 Recaplica · A project by Curi S.r.l. — VAT IT05472000750

    Statistics, only if you say so

    To learn which Recaps help most we would use Google Analytics, with aggregate, anonymous data. It starts only with your OK, and you can change your mind anytime. Privacy policy