recaplica
Clear in 30 seconds, yours in 10 minutes.
In 30 seconds quick read
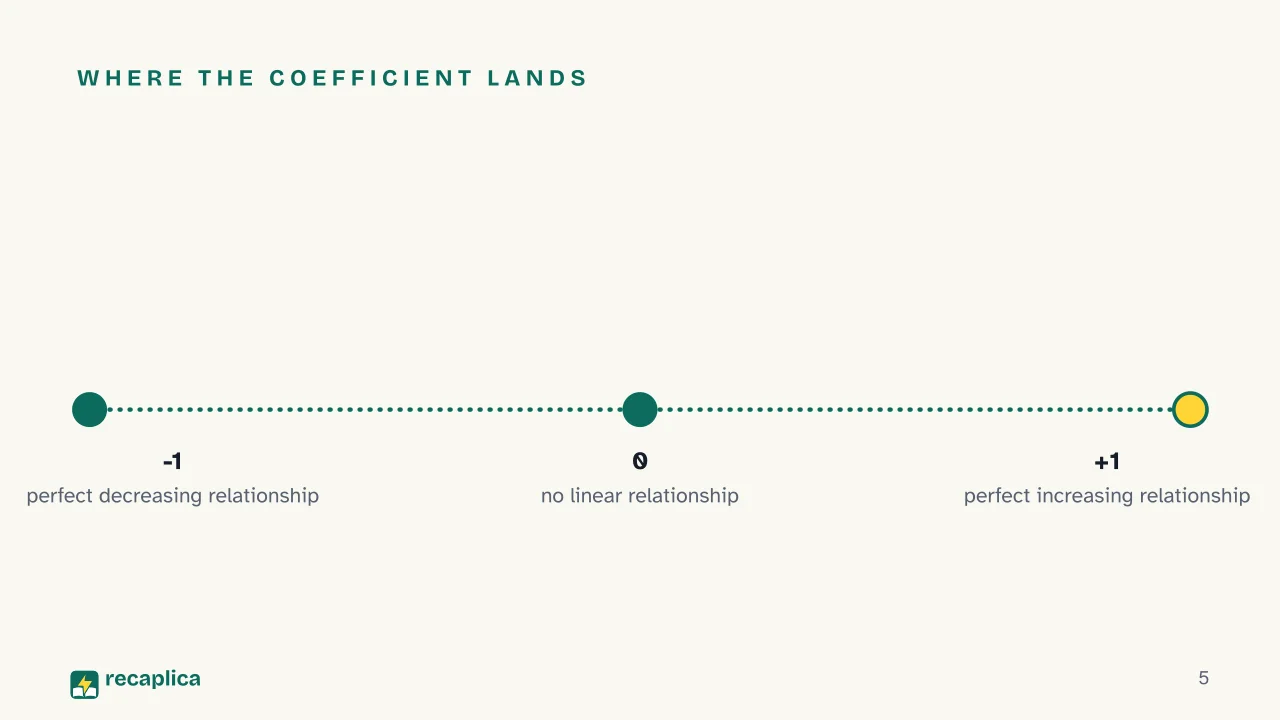
Correlation measures how closely two variables move together, and the most common way to put a number on it is the correlation coefficient, which runs from -1 to +1. A value near +1 means the two variables rise together, near -1 means one rises while the other falls, and near 0 means no linear relationship stands out. The coefficient only captures the strength of a straight-line relationship, and a single unusual data point can push it up or down by a lot. Even when it's strong, a correlation between two variables never shows that one causes the other.
Key Points
The correlation coefficient (r) measures the strength and direction of a linear relationship between two variables, on a scale from -1 to +1.
r = 1 means a perfect increasing relationship, r = -1 a perfect decreasing one, and r = 0 the absence of a linear relationship.
The farther r sits from 0, the stronger the linear relationship between the two variables.
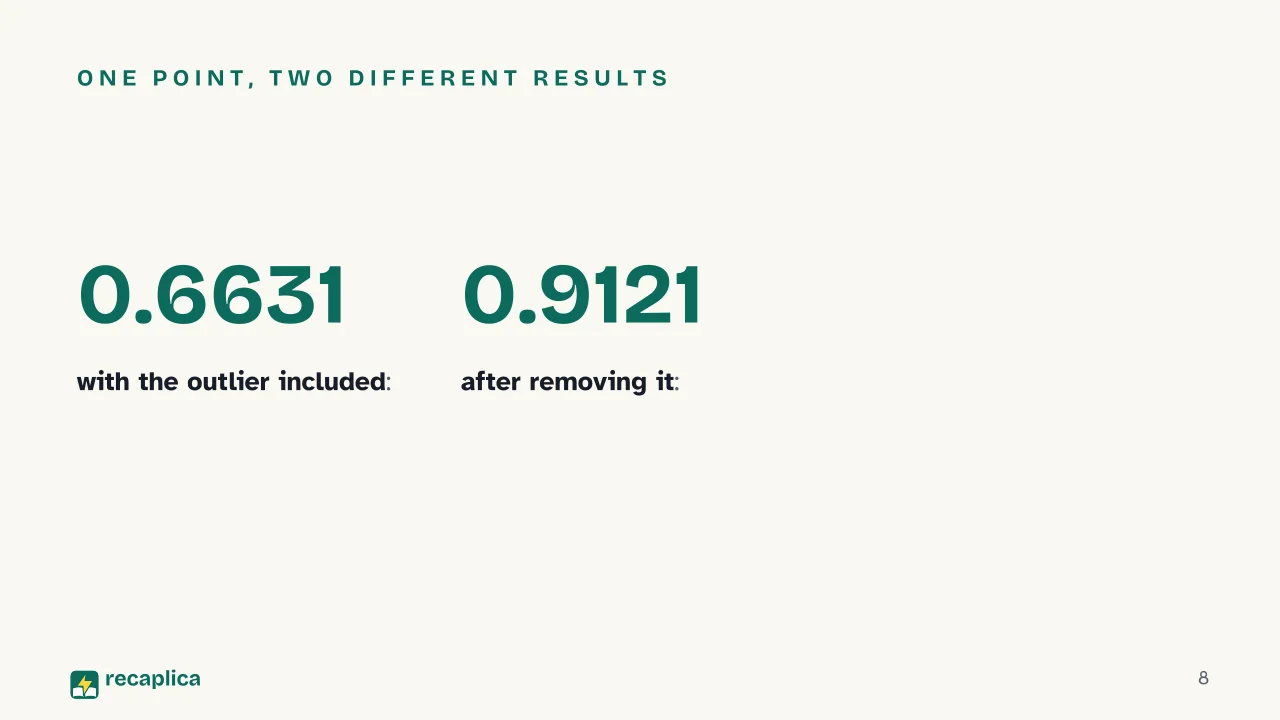
A single outlier can shift r by a wide margin: in an OpenStax example, removing one unusual point raised r from 0.6631 to 0.9121.
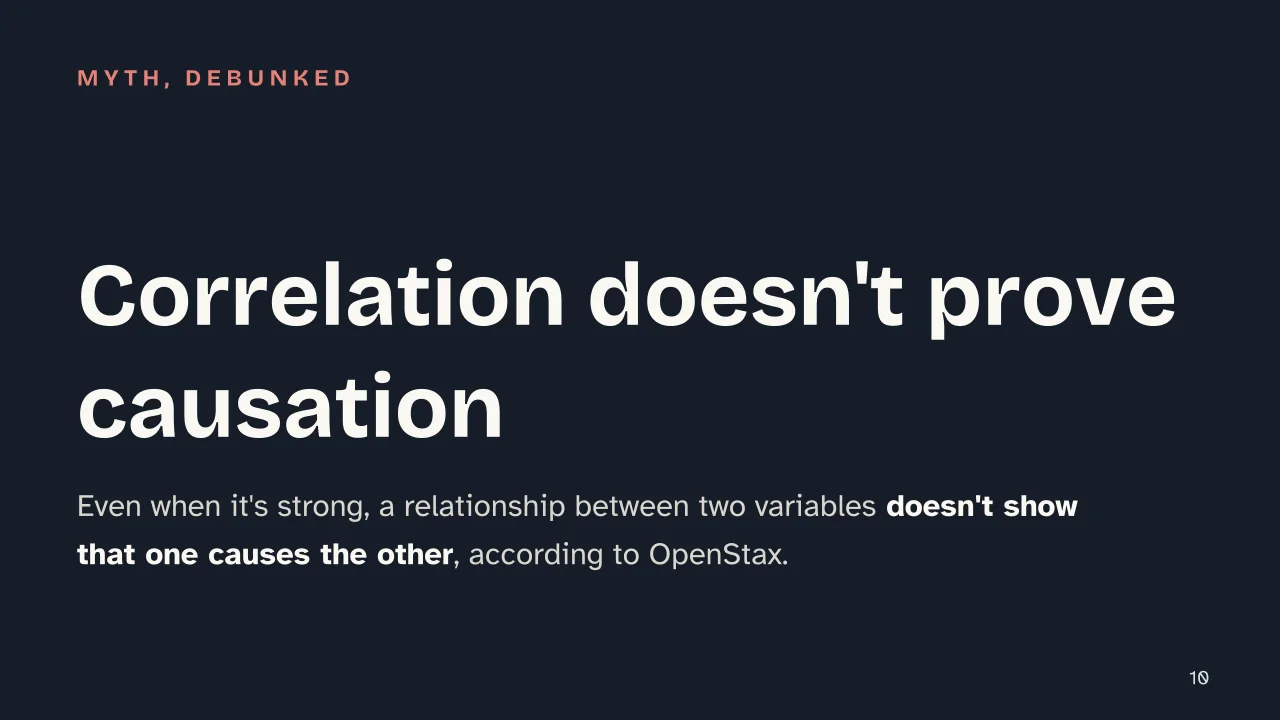
A strong correlation does not prove that one variable causes the other, according to OpenStax: it's the principle known as correlation without causation.
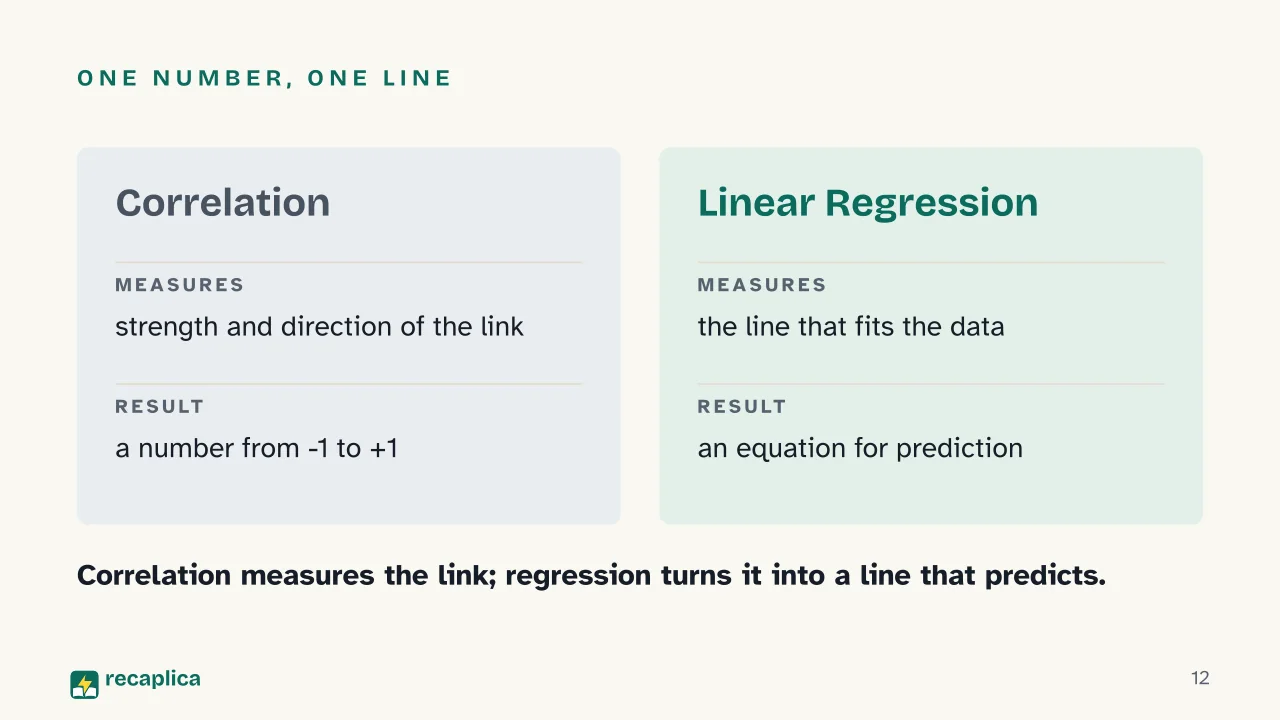
Correlation measures a relationship; linear regression builds the line that best describes it, for making predictions.
Deep Dive
Correlation measures how closely two variables move together. The usual way to quantify it is the correlation coefficient, written r for a sample: it was devised by Karl Pearson in the early twentieth century, according to OpenStax.
What the Correlation Coefficient Measures
Pearson’s correlation coefficient runs from -1 to +1, according to the NIST/SEMATECH e-Handbook of Statistical Methods. A value of +1 means a perfect increasing relationship between the two variables, and a value of -1 a perfect decreasing one: when one variable rises, the other falls at a constant rate. According to OpenStax, the closer the value sits to either extreme, the tighter the linear relationship between the two variables. Anyone who wants to review how data is organized and described before reaching this point can start with the page on descriptive statistics; the bigger picture of how probability and statistics work together is on the page about probability and statistics.
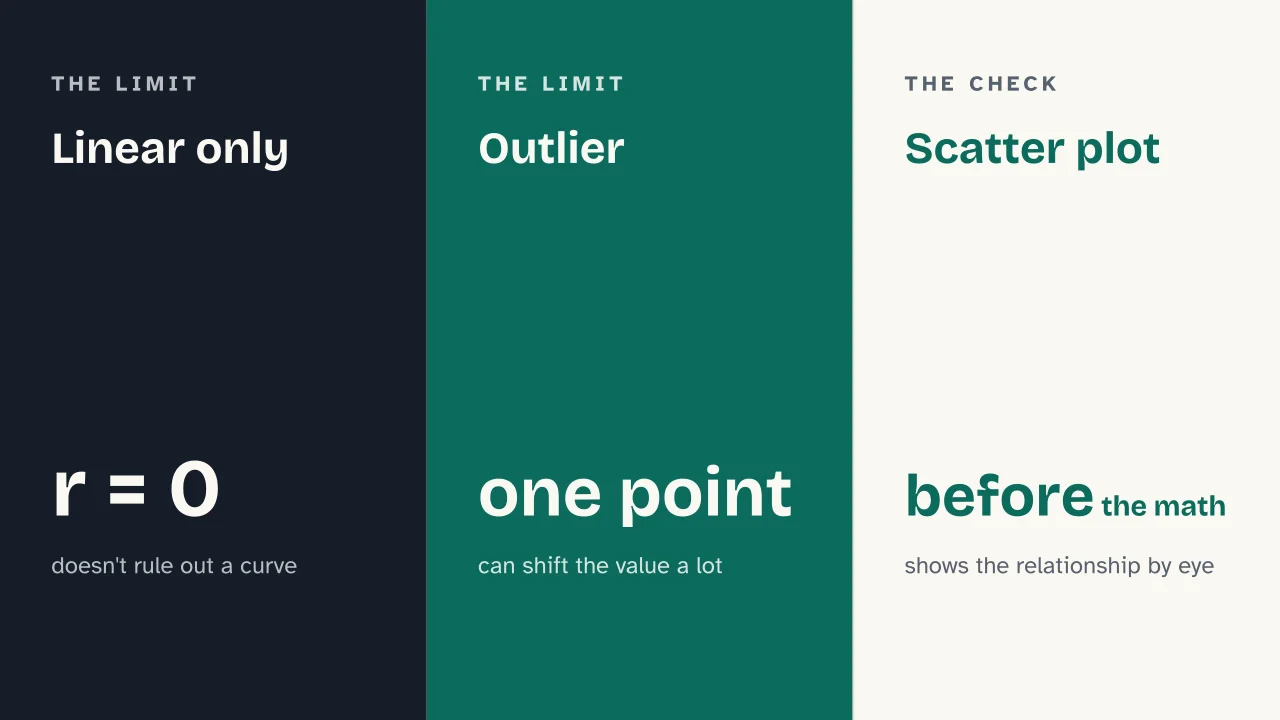
The first move in any correlation analysis, before r is even calculated, is the scatter plot: the points drawn on a chart show at a glance whether they follow an upward trend, a downward one, or no recognizable pattern at all. This visual check is why the scatter plot is called the standard tool for spotting whether two variables are associated, according to OpenStax.
Limits of the Coefficient: Outliers and Non-Linear Relationships
Pearson’s coefficient measures only linear relationships, and that produces two practical limits. A value of r = 0 signals that no straight-line pattern shows up between the two variables; according to OpenStax, a curved pattern can still sit underneath it and go unregistered by the coefficient. A coefficient can even turn out statistically significant while the scatter plot shows a curve rather than a straight line: a limit built into the tool itself.
The second limit concerns isolated data points.
Worked example: in an OpenStax exercise on a real dataset, the correlation coefficient was 0.6631 with one unusual point included; removing that single point raised the coefficient to 0.9121. A practical rule of thumb for flagging an outlier, from the same source, is a point sitting more than two standard deviations above or below the best-fit line. Not every outlier should be dropped, though: some carry real information about the phenomenon under study and belong in the analysis.
Correlation and Causation
Even when it’s real and well measured, a strong correlation between two variables doesn’t show that one causes the other: it’s the principle known as correlation does not imply causation, according to OpenStax. The coefficient describes how closely two variables move together, but it stays silent on why they do. Deciding whether an observed relationship is genuine or a coincidence calls for the tools of probability, not the correlation coefficient alone.
Correlation vs. Regression
Correlation and linear regression start from the same data but answer different questions. Correlation measures the strength and direction of a linear association between an independent variable x and a dependent variable y. Linear regression, instead, finds the line that best fits that data: according to OpenStax, the method — called least squares — makes the sum of the squared errors between the observed points and the line as small as possible. Outliers, in this context, are precisely the data points sitting farthest from that line.
Aspect
Correlation
Linear Regression
What it measures
Strength and direction of a linear relationship
The line that best fits the data
Method
Coefficient r (Pearson)
Least squares
Result
A number from -1 to +1
An equation that can predict
Devised by
Karl Pearson, early twentieth century
—
Correlation answers “how linked are these two variables.” Regression answers “what value would y take, given a certain x.”
Slide deck
Slides ready to download and make your own in PowerPoint or Google Slides, with speaker notes. Pick the Flash cut or the Full one.
✗ Myth A strong correlation between two variables proves that one causes the other.
✓ Reality OpenStax notes that even a strong correlation does not establish cause and effect: the coefficient can't tell a direct relationship apart from a coincidence.
✗ Myth A correlation coefficient close to 0 means two variables have no relationship at all.
✓ Reality According to OpenStax, r = 0 only rules out a linear relationship: the data can still follow a curve that Pearson's coefficient never picks up.
✗ Myth Correlation and regression are the same calculation under two names.
✓ Reality Correlation measures the strength of a linear relationship, while regression, using the least-squares method described by OpenStax, builds the line that best fits the data.
Mind map
Drag the background to move around and the nodes to reposition them; use − and + to collapse and expand branches.
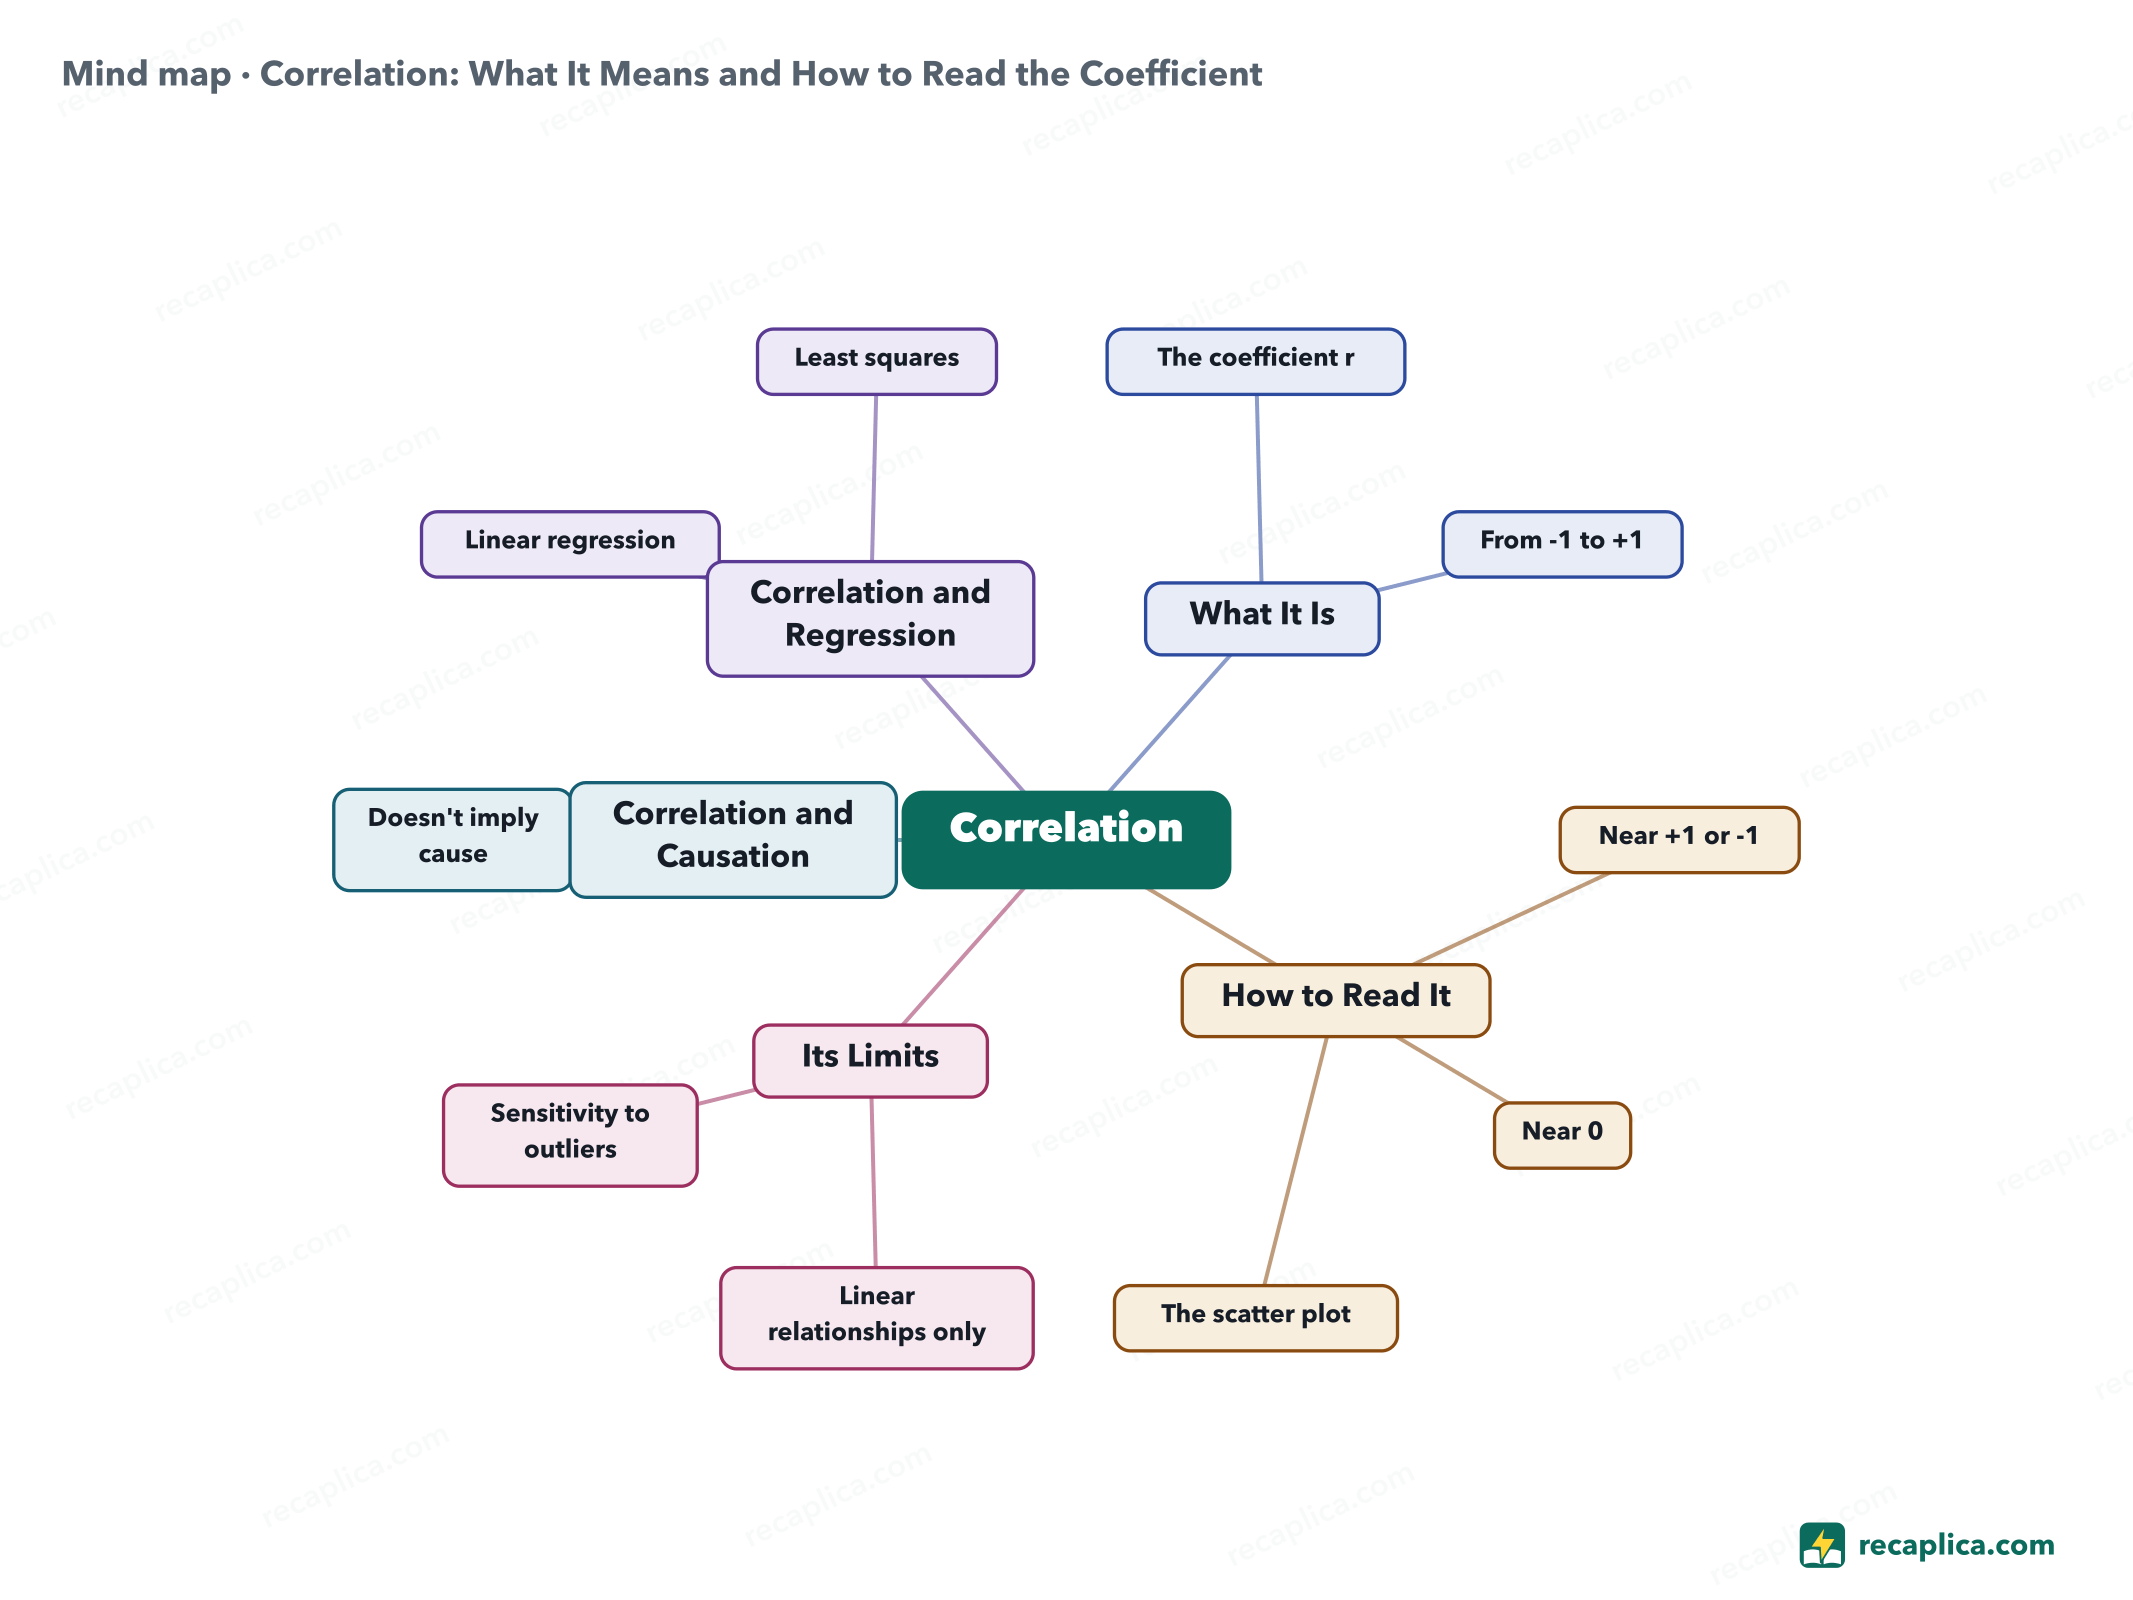
The coefficient rshows how strong and in what direction a linear link is, devised by Karl Pearson in the early twentieth century
From -1 to +1the scale used to read the value
How to Read It
Near +1 or -1a strong linear relationship
Near 0no clear linear relationship
The scatter plotshows the relationship before any coefficient is calculated
Its Limits
Linear relationships onlya curved pattern can stay invisible to r
Sensitivity to outliersone unusual point can shift the measured value a lot
Correlation and Causation
Doesn't imply causea strong relationship doesn't show that one variable causes the other
Correlation and Regression
Linear regressionfinds the line with the smallest error against the observed data
Least squaresthe method that minimizes the error between the points and the line
Quiz: test yourself
Answer the questions to check what you have learned: you get instant feedback and a short explanation.
Grade0/100/5
Answers: 1-A · 2-A · 3-B · 4-A · 5-A
Flashcards
Tap the card to flip it and check whether you remember the answer, then move to the next one.
1 / 8
Explain it in your own words
The ultimate test: if you can explain it in simple words, you've truly understood it. Write your explanation, then compare it with the Recap.
Your explanation is saved only on this device.
Correlation measures how closely two variables move together, and the most common way to put a number on it is the correlation coefficient, which runs from -1 to +1. A value near +1 means the two variables rise together, near -1 means one rises while the other falls, and near 0 means no linear relationship stands out. The coefficient only captures the strength of a straight-line relationship, and a single unusual data point can push it up or down by a lot. Even when it's strong, a correlation between two variables never shows that one causes the other.
Frequently asked questions
What is correlation?
Correlation is how closely two variables move together and in which direction: the farther the value sits from 0, toward +1 or -1, the stronger the linear relationship, according to OpenStax.
What does the correlation coefficient mean?
It's the number, written r for a sample, that shows how tight the linear relationship is between two variables; it runs from -1 to +1, according to the NIST/SEMATECH e-Handbook.
Does statistical correlation prove causation?
Even a strong statistical correlation doesn't prove that one variable causes another: it's the principle known as correlation without causation, according to OpenStax.
Are correlation and regression the same thing?
They measure different things: correlation quantifies how strong a linear relationship is, while regression builds an equation that fits the data and can be used to make predictions.
Is a high correlation coefficient always reliable?
Not always: according to OpenStax a single outlier can push the measured value up or down by a lot, and a coefficient can turn out significant even when the data actually follows a curved pattern.
Every Recap goes through an independent review before publication.
Statistics, only if you say so
To learn which Recaps help most we would use Google Analytics, with aggregate, anonymous data. It starts only with your OK, and you can change your mind anytime. Privacy policy