Skip to content
recaplica

    One moment: security check

    Cloudflare wants to make sure you're not a robot. Tick the box below and your search will continue on its own.

    IT
    recaplica Social Mobility: How People Move Up and Down in Society
    © 2026 Recaplica · recaplica.com — All rights reserved
    Home › Civics

    Social Mobility: How People Move Up and Down in Society

    By Recaplica Newsroom · Updated on October 6, 2026

    What to print

    Page numbers appear when printing with default margins.

    Slides

    Choose a cut

    Flash10 slidesThe essential thread, to present in classFull16 slidesEvery chapter and the deeper detail

    Both come with speaker notes.

    Telegram channel
    recaplica Clear in 30 seconds, yours in 10 minutes.
    In 30 seconds Key points Figures Deep dive Slides Myths Mind map Quiz Flashcards FAQ

    In 30 seconds quick read

    Social mobility is how much a person's or a family's position in society changes over time. The change can be vertical, moving up or down a social class, or horizontal, moving to a different position at the same level. Intergenerational mobility compares someone with their parents, while intragenerational mobility tracks the same person across different points in their own life. Education, family background and a country's economic conditions all shape how much mobility is possible. In Italy, the 2026 ISTAT annual report found that among people born between 1980 and 1994, more moved down a social class than up compared with their parents (27.1% versus 25.1%) — the first time this has happened.

    Key Points

    • Moving to a different position in society, whether up, down or sideways, is what sociologists call social mobility.
    • Vertical mobility moves someone up (upward) or down (downward) the social scale; horizontal mobility changes position while staying at the same level.
    • Intergenerational mobility compares a person's position with their parents'; intragenerational mobility compares the same person at different stages of their own life.
    • Education, family background, and economic, cultural and social capital all help or hold back social mobility.
    • According to the 2026 ISTAT annual report, among people born between 1980 and 1994, downward mobility (27.1%) has overtaken upward mobility (25.1%) for the first time.
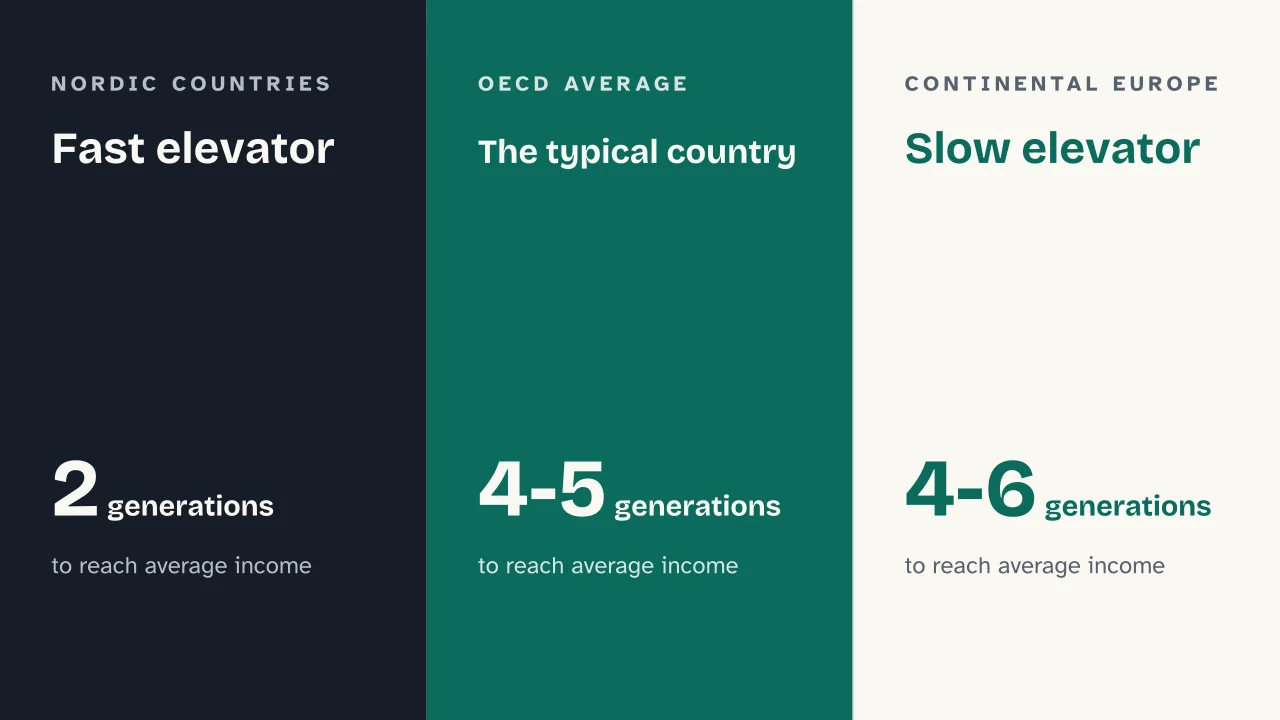
    • In Nordic countries it takes only two generations for a family to go from the lowest income bracket to the average income, according to the OECD; in continental Europe the same climb takes four to six.

    Key figures

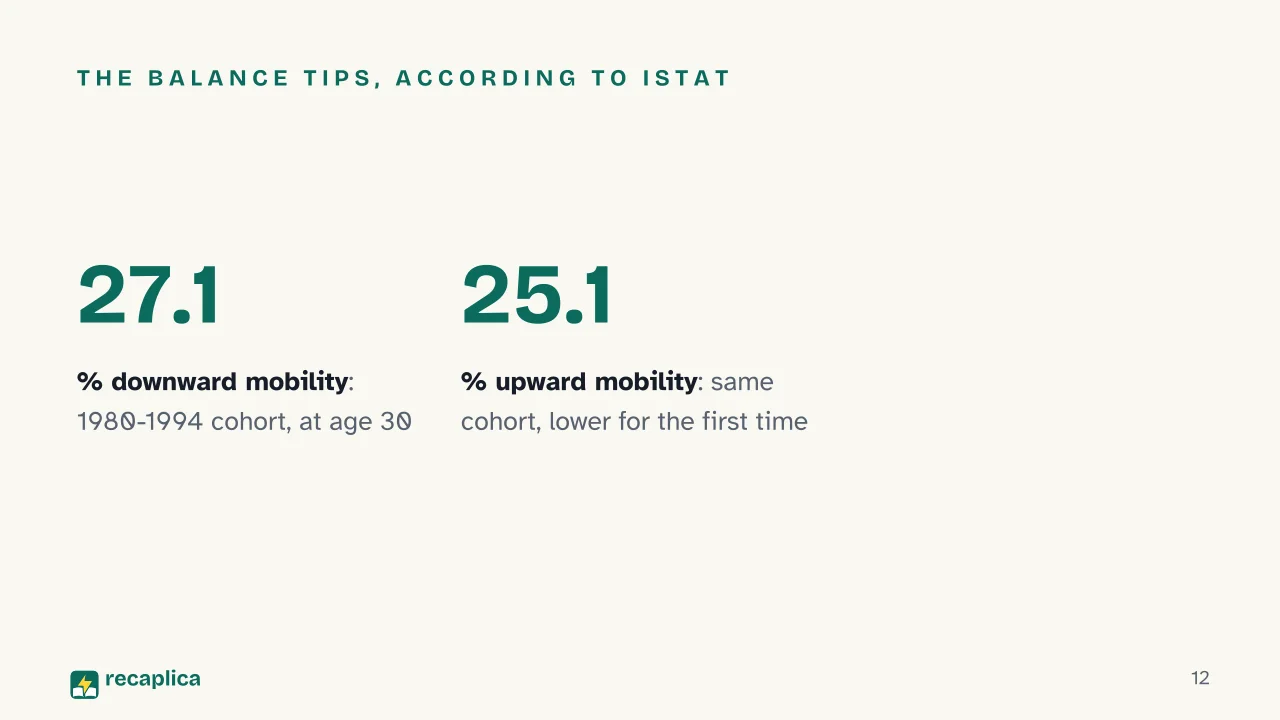
    • 27.1% the share of workers born between 1980 and 1994 who, at age 30, are in a lower occupational class than their parents (downward mobility), according to the 2026 ISTAT annual report. Source: ISTAT, Rapporto annuale 2026
    • 25.1% the share of the same cohort who instead reach a higher occupational class than their parents (upward mobility): for the first time it is lower than the downward figure, reversing the pattern seen throughout the 20th century, according to the same report. Source: ISTAT, Rapporto annuale 2026

    Deep Dive

    What Is Social Mobility

    When the child of a factory worker becomes an engineer, or when someone who opened a small shop sees it fail and goes back to working for someone else, that is social mobility in action. Treccani defines the concept as the movement of an individual, or of a social value, from one position to another. The idea sits close to social status, the position a person occupies at a given moment: social mobility is the change in that position, not the position itself.

    A sociology textbook (LibreTexts) adds that the phenomenon concerns groups just as much as individuals, often through a new job or a marriage.

    Forms of Social Mobility

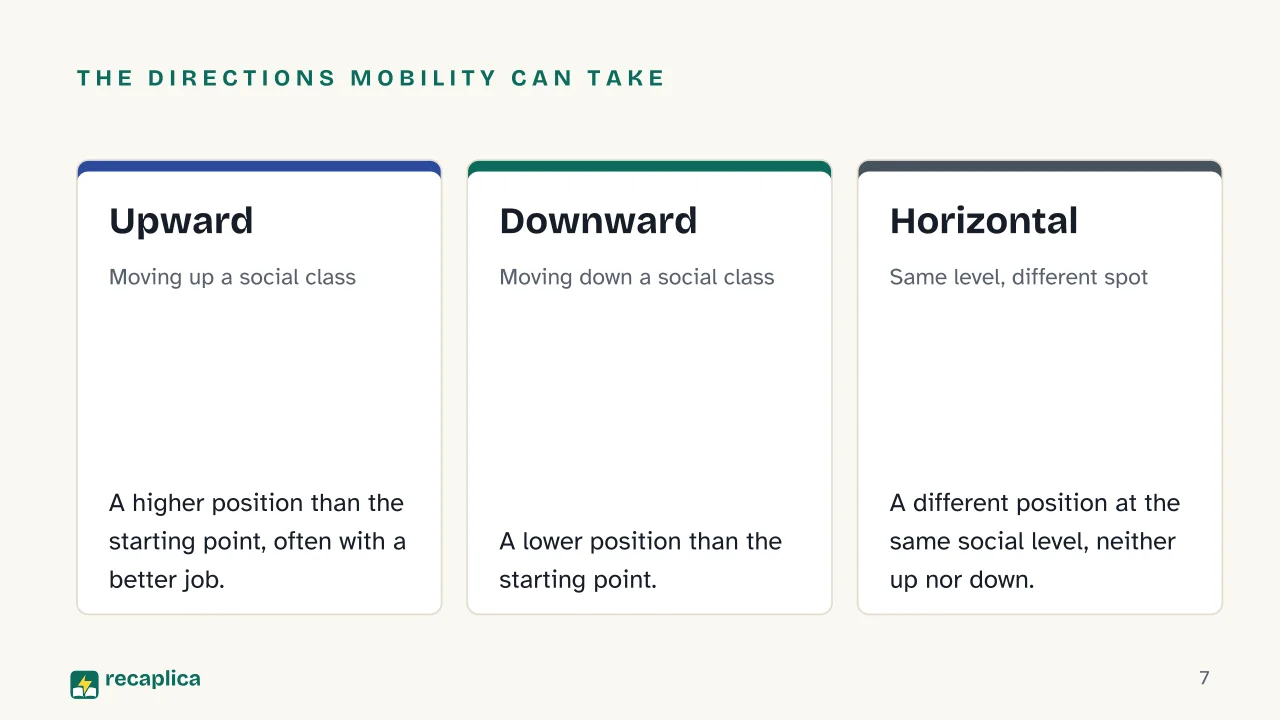
    Treccani distinguishes two main directions. Vertical mobility moves a person up or down the social scale: it is called upward mobility when someone rises, and downward mobility when someone falls. Horizontal mobility, by contrast, changes a person’s position while keeping them at the same social level: a teacher who moves from one school to another, while remaining a teacher, is moving horizontally.

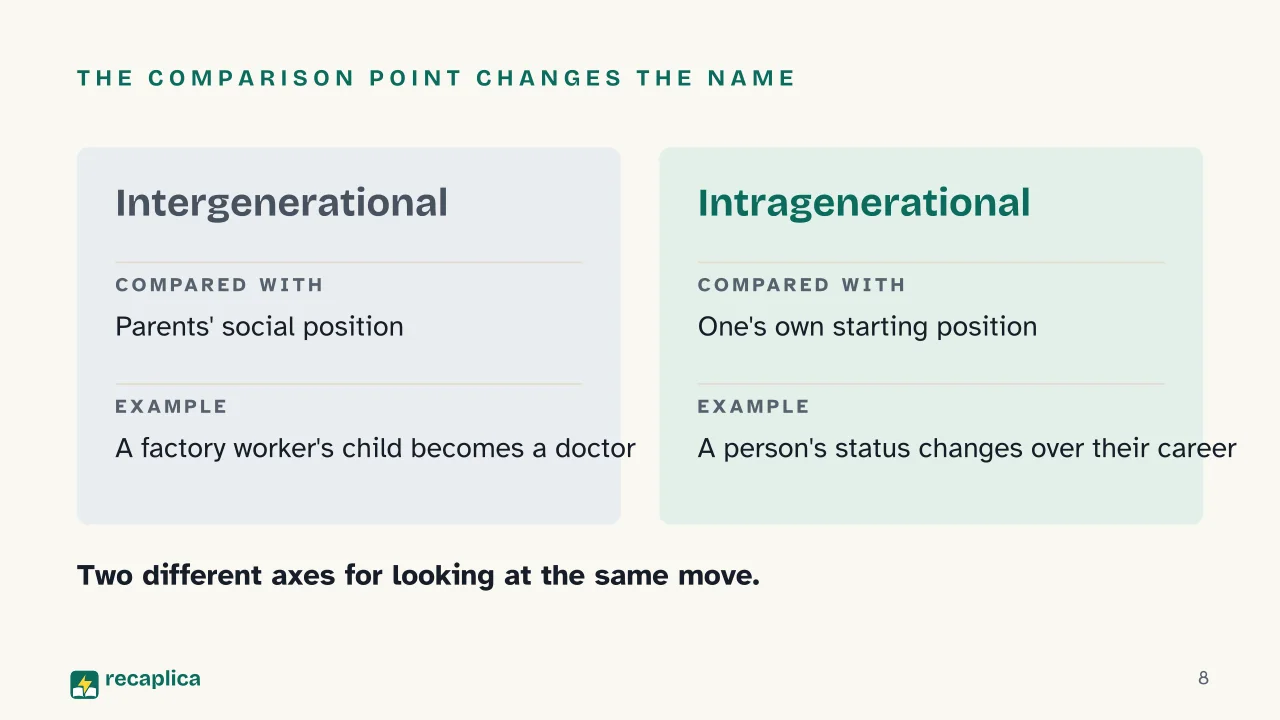
    Alongside this first distinction sits another one, about the point of comparison. Intergenerational mobility compares a person’s social position with that of their parents or family of origin; intragenerational mobility instead looks at the same person’s path over the course of their own life, an internal comparison rather than one between generations.

    Type of mobilityWhat changesExample
    Upward verticalMoving up a social classA factory worker becoming a manager
    Downward verticalMoving down a social classA business owner who loses the company and takes a more modest job
    HorizontalChanging position, same levelA teacher switching schools
    IntergenerationalCompared with parentsA doctor whose parents were farmers
    IntragenerationalCompared with oneself over timeA factory worker who becomes a shift supervisor at the same plant

    Worked example: two brothers grow up in the same working-class family. The first finishes university and becomes a lawyer: for him, that is upward, intergenerational mobility, because he rises above his parents. The second stays a factory worker like his father, but over his career moves from the production line to a coordinating role at the same plant: for him, that is intragenerational mobility, a change internal to his own life, unrelated to any comparison with the previous generation.

    What Helps, or Hinders, Social Mobility

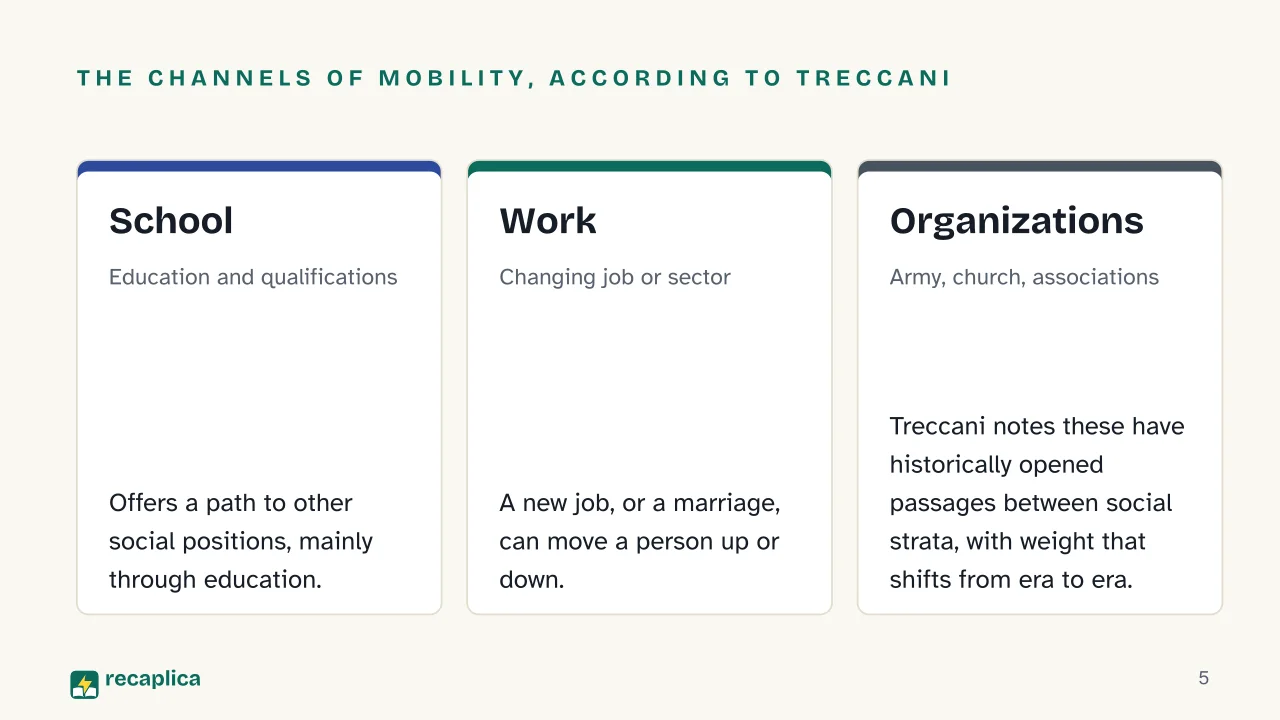
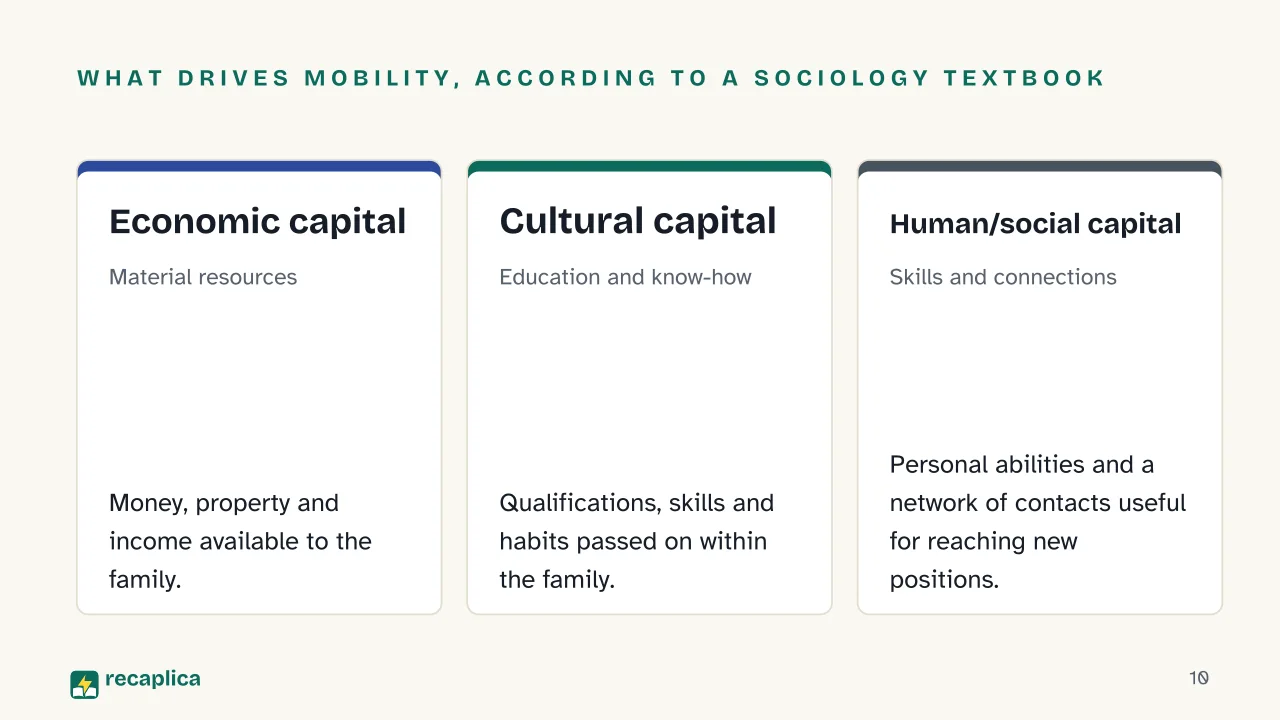
    According to Treccani, some institutions have historically acted as channels allowing people to move from one social stratum to another: schools, the army, the church, and political, economic and professional organizations, with an influence that shifts from era to era and from society to society. The sociology textbook cited above adds a complementary angle, closer to the resources available to each individual: mobility can be helped by economic capital (money and property), cultural capital (qualifications, skills, habits passed down within the family), human capital (personal abilities) and social capital (a person’s network of relationships).

    These factors also explain why family background keeps mattering. The socialization a person receives as a child, within their own family, already transmits part of that cultural capital: reading habits, expectations about schooling, a certain way of navigating the workplace. A country’s economic inequality and its social mobility tend to move together: where families start out far apart, the distance they have to travel tends to stretch out too.

    Education alone is not enough to guarantee moving up. The OECD calculates that four people out of ten whose parents have a low level of education go no further than lower secondary school, while only one in ten from that same group reaches university. School remains an important channel, but one that works together with the starting point a family provides. That is part of why many countries hand some of this task to the welfare state, through public education, health care and income-support policies designed to widen the opportunities available to those who start from harder conditions.

    How Much People Actually Move: The Data

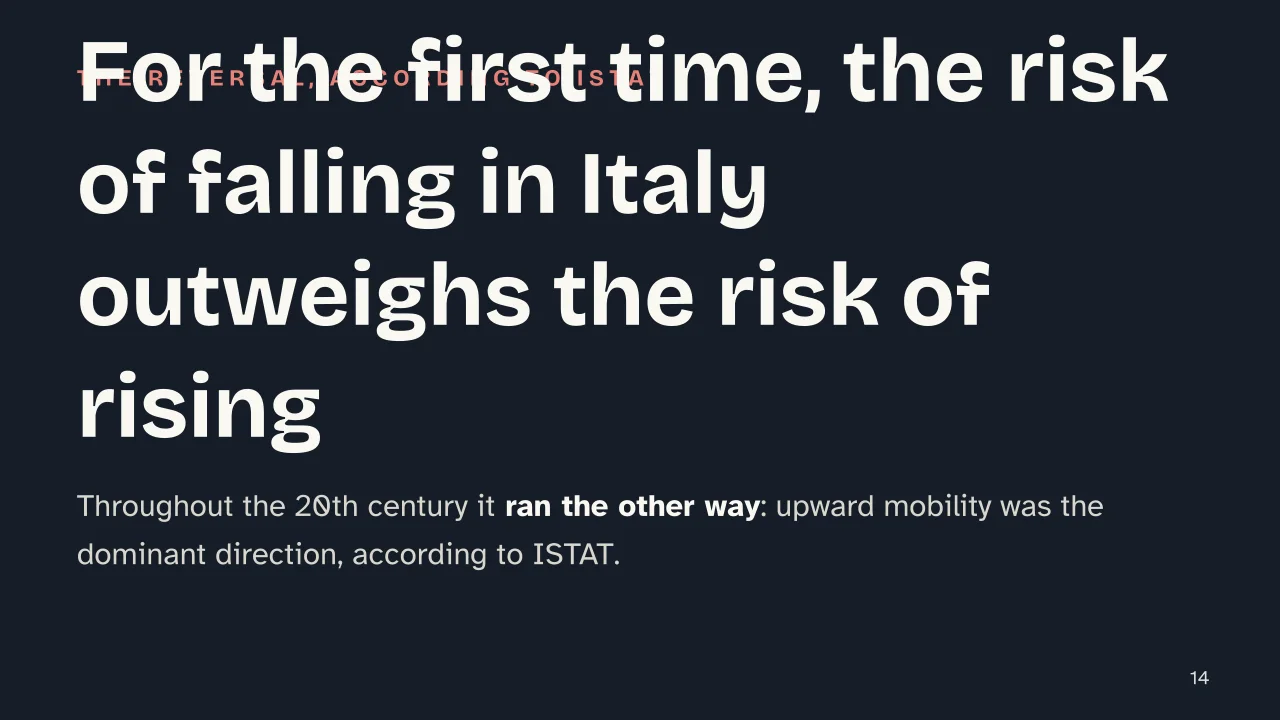
    In Italy, the 2026 ISTAT annual report measured intergenerational mobility for the cohort of workers born between 1980 and 1994. Close to three in ten, 27.1%, saw their occupational class fall below their parents’ by age 30: that is downward mobility. Those who climbed, in the same generation, stop at 25.1%. According to ISTAT, this is the first time it has happened this way: throughout the 20th century, the prevailing direction had been the opposite one, upward.

    Looking beyond Italy, the OECD published a report in 2018 devoted to exactly this topic, titled A Broken Social Elevator? According to that study, the average OECD country needs roughly four or five generations for children born into the lowest income decile to reach the average income level. The figure, though, varies widely from country to country: Nordic countries need only about two generations, while continental Europe needs between four and six. The gap between a fast social elevator and a slow one separates even economies that share a similar level of wealth.

    Slide deck

    Slides ready to download and make your own in PowerPoint or Google Slides, with speaker notes. Pick the Flash cut or the Full one.
    Slide 1 of the presentation on Social Mobility: Social MobilitySlide 2 of the presentation on Social Mobility: Compared with their parents, do more people rise or fall?Slide 3 of the presentation on Social Mobility: Definition, forms, drivers, dataSlide 4 of the presentation on Social Mobility: Chapter 01: What social mobility isSlide 5 of the presentation on Social Mobility: The channels of mobility, according to Treccani: School, Work, OrganizationsSlide 6 of the presentation on Social Mobility: Chapter 02: Its formsSlide 7 of the presentation on Social Mobility: The directions mobility can take: Upward, Downward, HorizontalSlide 8 of the presentation on Social Mobility: The comparison point changes the nameSlide 9 of the presentation on Social Mobility: Chapter 03: What drives itSlide 10 of the presentation on Social Mobility: What drives mobility, according to a sociology textbook: Economic capital, Cultural capital, Human/social capitalSlide 11 of the presentation on Social Mobility: Chapter 04: The data, in Italy and worldwideSlide 12 of the presentation on Social Mobility: The balance tips, according to ISTATSlide 13 of the presentation on Social Mobility: Fast elevator · The typical country · Slow elevatorSlide 14 of the presentation on Social Mobility: For the first time, the risk of falling in Italy outweighs the risk of risingSlide 15 of the presentation on Social Mobility: Is it true that social mobility is the same in every wealthy country?Slide 16 of the presentation on Social Mobility: Now, time to review
    Flash10 slidesThe essential thread, to present in classFull16 slidesEvery chapter and the deeper detail

    Common myths

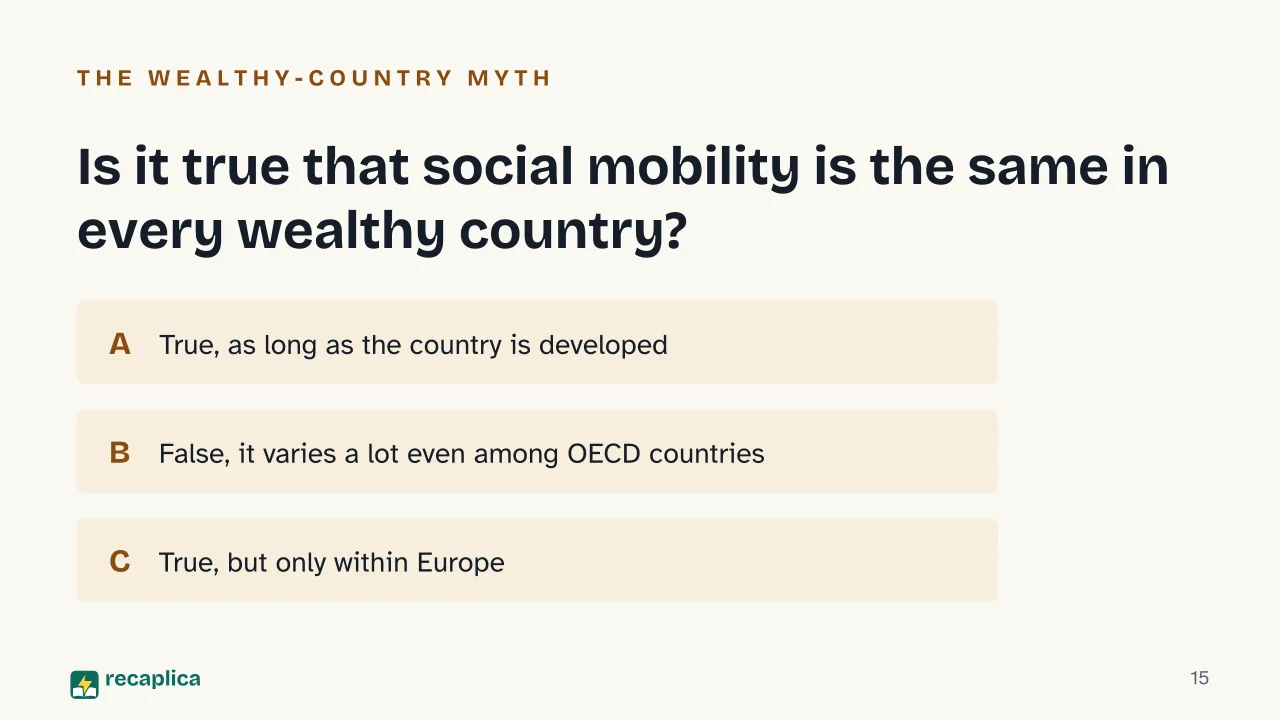
    • ✗ Myth Social mobility would be roughly the same across all wealthy countries, as long as you live somewhere developed.

      ✓ Reality According to the OECD, a child born into the lowest income decile reaches the average income in about two generations in Nordic countries, but it takes four to six generations in continental Europe: even among rich, OECD economies, intergenerational mobility varies enormously.

    • ✗ Myth Doing well in school would be enough to guarantee moving up in society, regardless of family background.

      ✓ Reality According to the OECD, out of ten people whose parents have low educational attainment, four do not get past lower secondary school and only one reaches university; Treccani also notes that even in societies built on meritocratic values, barriers tied to family origin persist.

    Mind map

    Drag the background to move around and the nodes to reposition them; use − and + to collapse and expand branches.
    Customize
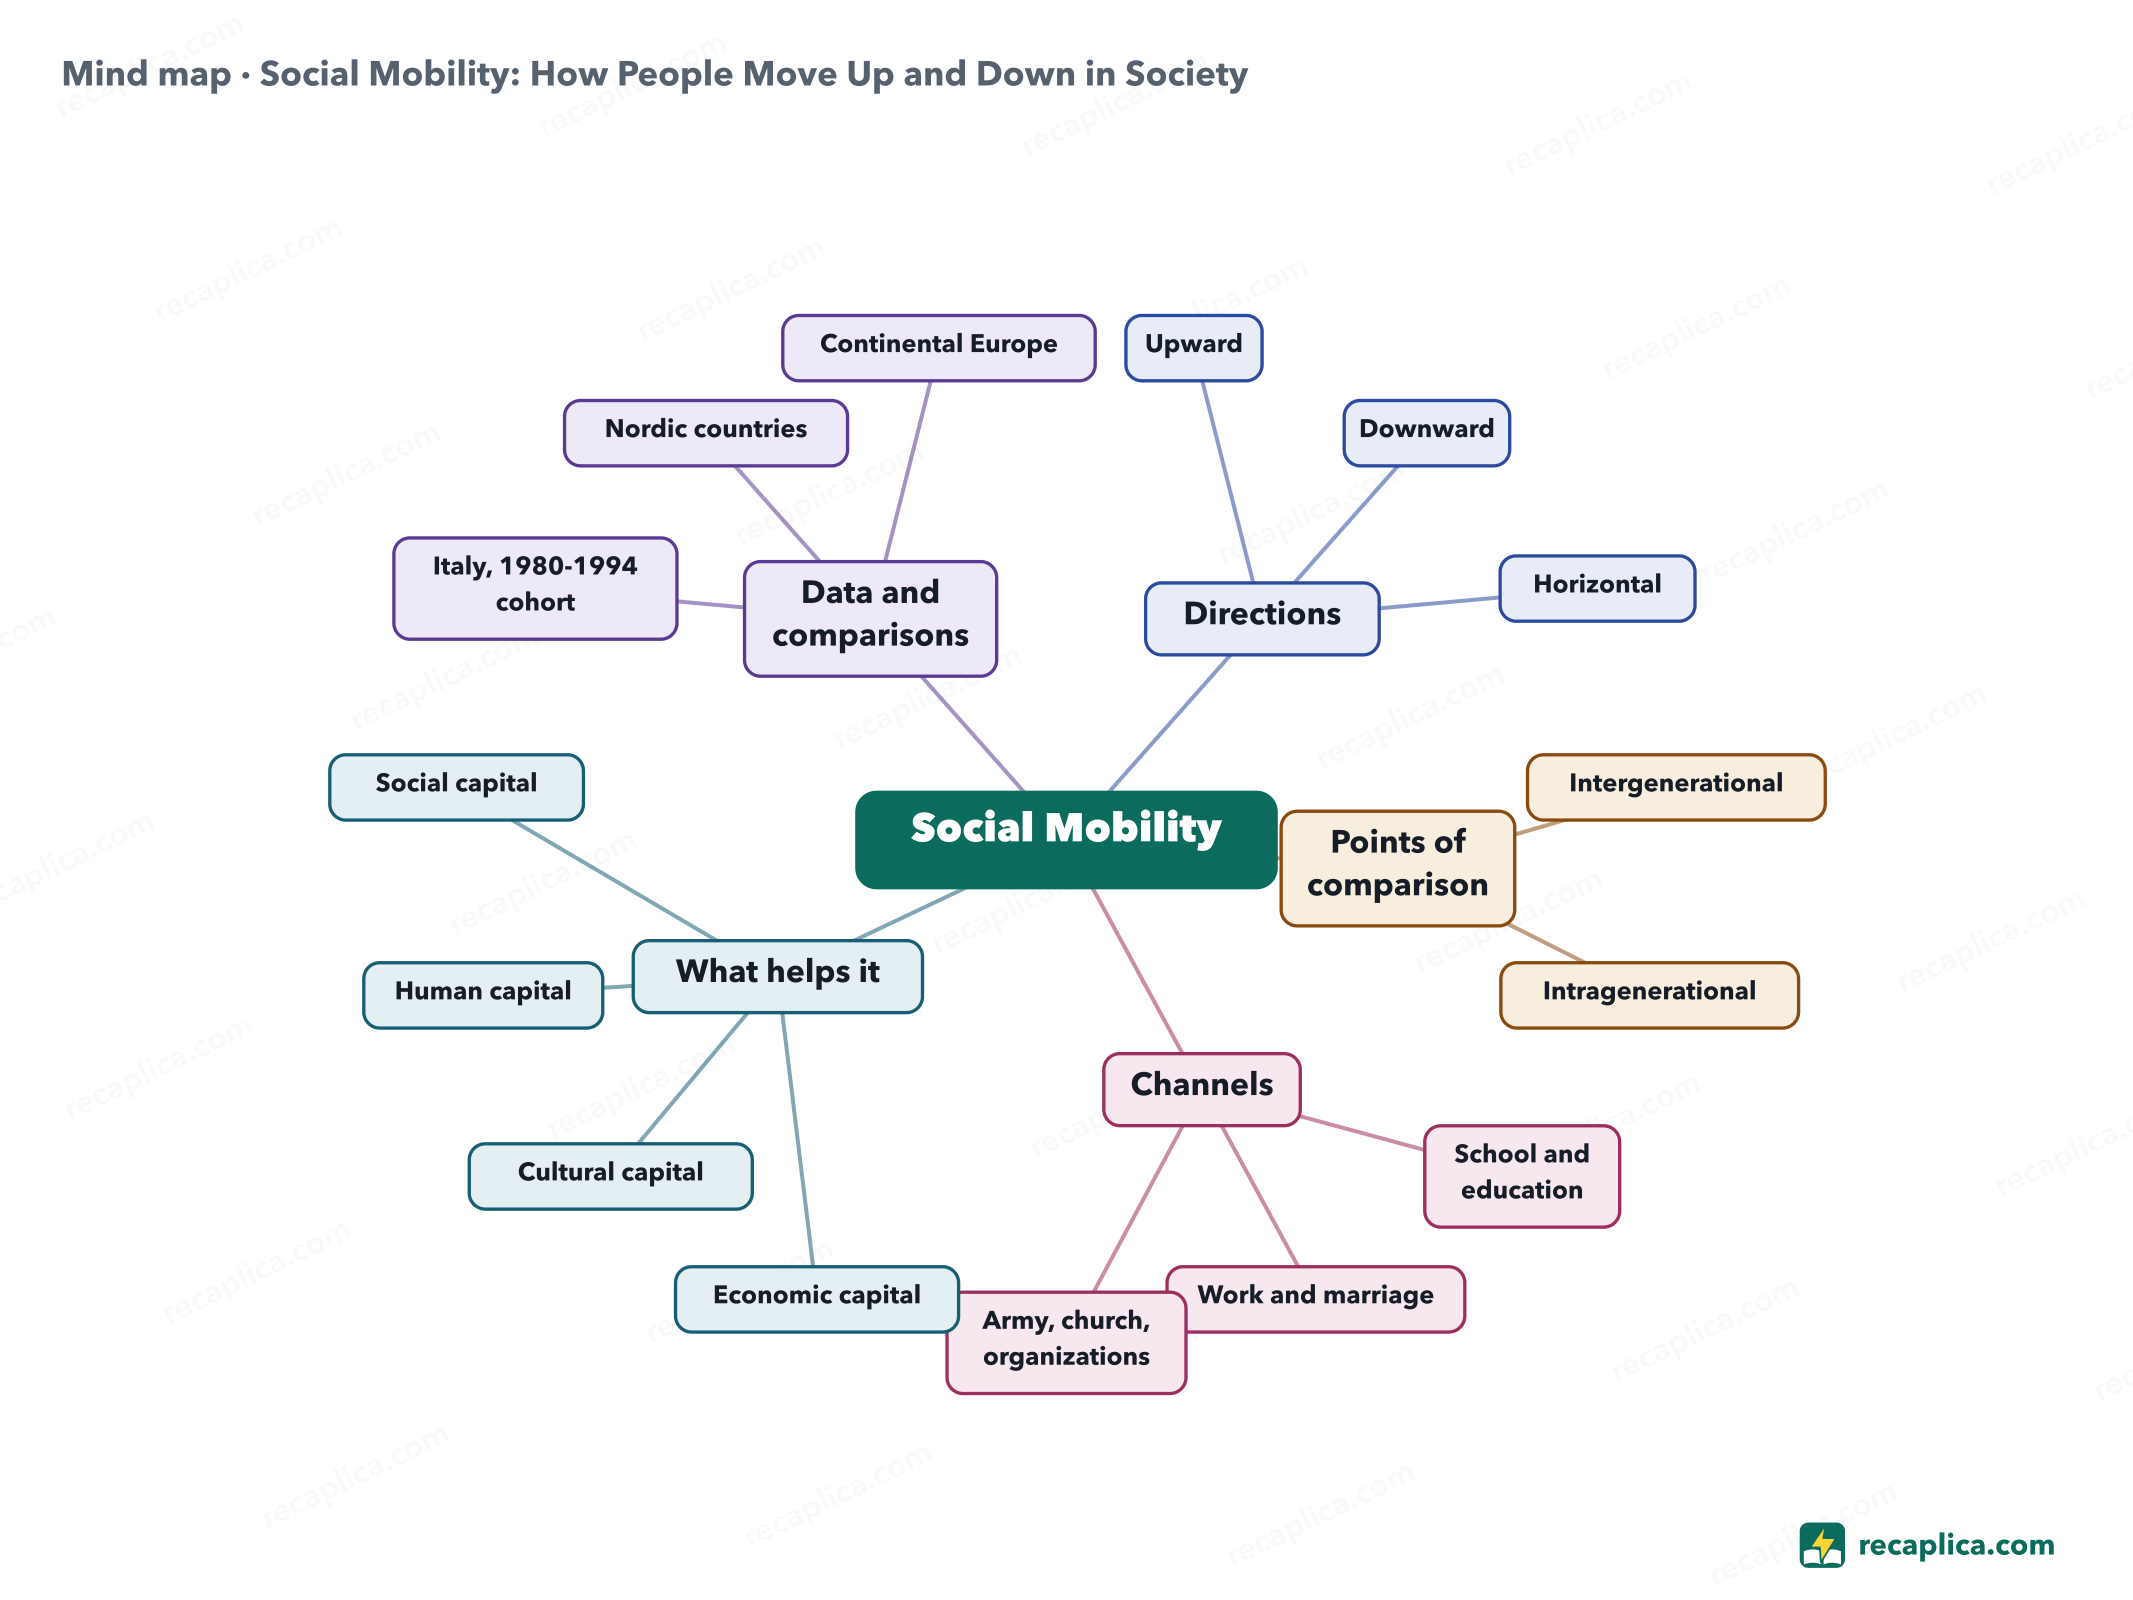
    Mind map: Social Mobility: How People Move Up and Down in Society
    • Social Mobility
      • Directions Upward, downward, or sideways
        • Upward Toward a higher position
        • Downward Toward a lower position
        • Horizontal Same level, different position
      • Points of comparison Who, or which point in time, is the reference
        • Intergenerational Compared with parents
        • Intragenerational Compared with oneself over time
      • Channels Treccani, institutions that open passages between strata
        • School and education
        • Work and marriage
        • Army, church, organizations
      • What helps it According to a sociology textbook
        • Economic capital
        • Cultural capital
        • Human capital
        • Social capital
      • Data and comparisons
        • Italy, 1980-1994 cohort ISTAT, Rapporto annuale 2026
        • Nordic countries OECD, about two generations
        • Continental Europe OECD, four to six generations

    Quiz: test yourself

    Answer the questions to check what you have learned: you get instant feedback and a short explanation.

    Grade 0/10 0/5
    1 What is social mobility?

    It is about a change in position on the social scale, not a geographic move or a country's overall economic growth.

    2 What is the difference between intergenerational and intragenerational mobility?

    Intergenerational mobility looks at the comparison with the family of origin; intragenerational mobility looks at a person's own path over the course of their life.

    3 What distinguishes horizontal mobility from vertical mobility?

    Vertical mobility shifts someone's rank on the social scale, up or down; horizontal mobility changes where they stand without changing that rank.

    4 According to the 2026 ISTAT annual report, what changed for the first time among people born between 1980 and 1994?

    In this generation the gap tips, for the first time according to ISTAT, in favor of those who fall: 27.1% end up below their parents, 25.1% end up above them.

    5 True or false: according to the OECD, social mobility is the same in every wealthy country.

    False: the OECD finds the pace varies a lot by region, with the social elevator running clearly faster in Nordic countries than in continental Europe.

    Answers: 1-A · 2-A · 3-A · 4-A · 5-B

    Flashcards

    Tap the card to flip it and check whether you remember the answer, then move to the next one.

    1 / 8

    Explain it in your own words

    The ultimate test: if you can explain it in simple words, you've truly understood it. Write your explanation, then compare it with the Recap.

    Your explanation is saved only on this device.

    Social mobility is how much a person's or a family's position in society changes over time. The change can be vertical, moving up or down a social class, or horizontal, moving to a different position at the same level. Intergenerational mobility compares someone with their parents, while intragenerational mobility tracks the same person across different points in their own life. Education, family background and a country's economic conditions all shape how much mobility is possible. In Italy, the 2026 ISTAT annual report found that among people born between 1980 and 1994, more moved down a social class than up compared with their parents (27.1% versus 25.1%) — the first time this has happened.

    Frequently asked questions

    What is social mobility?

    It describes a change in position on the social scale: vertical, when someone gains or loses a step in social class, or horizontal, when the position changes while staying at the same level.

    What are the types of social mobility?

    The main ones are vertical mobility (upward or downward), horizontal mobility, and the comparison across time: intergenerational, measured against parents, and intragenerational, measured across the same person's own life.

    What role does education play in social mobility?

    It is an important channel, but not decisive on its own: the OECD finds that among people whose parents have low educational attainment, four out of ten stop at lower secondary school and only one in ten completes a university degree.

    What does the 2026 ISTAT report say about social mobility in Italy?

    For people born between 1980 and 1994, the 2026 ISTAT report found that, at age 30, more workers had moved down a level compared with their parents (27.1%) than up (25.1%): it is the first time the gap has run in this direction.

    Sources

    • ISTAT, Rapporto annuale 2026 — Equità e coesione, basi del benessere collettivo
    • Treccani, Mobilità sociale — Enciclopedia delle scienze sociali
    • OECD, A Broken Social Elevator? How to Promote Social Mobility (2018)
    • LibreTexts/Social Sci (Solano Community College), 9.4: Social Mobility

    Every Recap goes through an independent review before publication.

    Every evening, the day's new Recaps on our Telegram channel. Join the channel →

    Keep learning

    • Civics What Is Pi Day? Why It Falls on March 14 Pi Day is a yearly observance on March 14, chosen because the US date format writes that day as 3/14, matching pi's first digits. Larry Shaw, a physicist at San Francisco's Exploratorium, came up with it in 1988 during a staff retreat at the museum. What started as a small party among coworkers grew into a public celebration with a parade, pie, and a 2009 resolution from the US Congress. Today it's mostly marked in schools and science museums, with digit-memorization contests and discounts at pizza and dessert shops. Read the Recap →
    • Civics Mass Media: What They Are Mass society is a type of society where ordinary people carry real weight in political and social life, but at a cost: more conformity, less individual autonomy, greater exposure to manipulation. The Treccani encyclopedia places its rise between the late 19th and early 20th century, when population growth, urbanization, mass schooling, wider voting rights and industrial organization converge. Mass media, radio and film first, then satellites and the internet, make it possible on a scale never seen before. The Frankfurt School and Ortega y Gasset turned it into an object of criticism, from two different angles: a culture industry that standardizes, and a mass man who blends into the average. Read the Recap →
    • Civics Secularization: Definition, Theories, and How It Shapes Society Secularization is the process through which religious institutions, practices, and beliefs lose social weight, as a society leans more on reason and science, according to EBSCO Research Starters. It shows up on three different levels: institutions, a country's shared culture, and the religious choices each person makes. Max Weber described it as the disenchantment of the world, the modern rationalization that pushed religion and metaphysics outside the boundaries of legitimate knowledge; Émile Durkheim linked it, in 1912, to the split between the sacred and the profane. Pew Research Center data from 2024 show how unevenly the process plays out: in India, Israel, Nigeria, and Thailand, 95% or more of adults still belong to the religion they grew up in, while in South Korea half of adults have left theirs behind. Read the Recap →

    recaplica

    Clear in 30 seconds, yours in 10 minutes.

    Recaps Mind maps Request a Recap Telegram channel Mind map maker Our method About Privacy & cookies Legal notes & terms of use

    © 2026 Recaplica · A project by Curi S.r.l. — VAT IT05472000750

    Statistics, only if you say so

    To learn which Recaps help most we would use Google Analytics, with aggregate, anonymous data. It starts only with your OK, and you can change your mind anytime. Privacy policy