|
recaplica
Developer Options: How to Enable Them on Android, iPhone, and Your Browser | ||||||||||||||
| © 2026 Recaplica · recaplica.com — All rights reserved | ||||||||||||||
Developer Options: How to Enable Them on Android, iPhone, and Your BrowserWhat to print Page numbers appear when printing with default margins. SlidesChoose a cut Flash10 slidesThe essential thread, to present in classFull18 slidesEvery chapter and the deeper detailBoth come with speaker notes. In 30 seconds quick readDeveloper options are a panel of advanced settings, hidden by default, meant for people who build or test an app rather than for everyday use. On Android it unlocks by tapping the build number seven times in the phone's system information, until a confirmation message appears. On iPhone and iPad the same feature is called Developer Mode, introduced with iOS 16 in 2022, and it needs a restart plus an explicit confirmation before it actually turns on. Browsers hide their own equivalent too: Safari keeps its Develop menu switched off by default in Advanced settings, while Chrome and Firefox open their respective tools with a keyboard shortcut or from the main menu. Key Points
Key figures
Deep DiveWhy they’re switched off by defaultEvery operating system and every browser hides, behind a small ritual of activation, a panel of adjustments meant for people who build software, not for the people who use it every day. It’s not a whim: these are features that let you do things like install an app that hasn’t been published yet, watch a page’s network traffic, or artificially throttle the CPU to simulate a slower phone. Keeping them off for most people stops them from ending up, by accident, in the hands of someone who doesn’t know what they mean: in line with this logic, as we’ll see, Apple in particular puts an explicit confirmation step in front of them. Android: seven taps to “become a developer”On Android, developer options stay hidden until you go looking for them, and the path to find them changes from one manufacturer to another. On a Google Pixel they’re in Settings, under About phone; on a Samsung Galaxy S8 or later you need to go into Software information; on an LG G6 or later the label reads Software info; on an HTC U11 or later the Build number entry sits under About, in Software information, under More; on a OnePlus 5T or later it stays under About phone. What never changes is the gesture itself: tapping the Build number entry seven times in a row.
That panel also holds USB debugging, the feature that lets a computer connected by cable communicate with the phone to install test apps. Here too the exact path depends on the Android version: from Android 9 onward it’s under Settings > System > Advanced > Developer options > USB debugging, on Android 8.0 and 8.1 it’s simply Settings > System > Developer options > USB debugging, while on Android 7.1 and earlier the entry sits directly under Developer options. Debugging over Wi-Fi (wireless debugging) follows a similar logic but arrived later: from Android 16 it’s under Settings > System > Developer options > Wireless debugging. iPhone and iPad: Developer Mode with a double confirmationOn iOS and iPadOS, the equivalent is called Developer Mode, and it didn’t exist before 2022: it arrived with iOS 16, alongside watchOS 9, so it isn’t available on earlier system versions. It’s found in Settings > Privacy & Security, where the Developer Mode entry appears near the bottom of the page. Flipping the switch, though, isn’t enough on its own. The phone first asks to restart, and only after the restart, once the device is unlocked again, does a second prompt appear asking for an explicit confirmation of the choice. Apple describes this two-step process as a measure meant to protect the person using the phone from unwanted installations of potentially harmful software, and to reduce the ways developer-only functionality could be exploited. Without Developer Mode turned on, an app installed locally — for example through Xcode or Apple Configurator — still installs but refuses to launch: that’s precisely the use case the feature targets, alongside installing test builds through side-loading. Safari: the Develop menu and Web InspectorOn Mac, Safari hides its Develop menu from the menu bar by default. To make it appear, open the browser’s Settings panel (called Preferences in older versions), switch to the Advanced tab, and check the option that shows features for web developers. Once it’s on, the Develop menu gives access to Web Inspector, the tool that lets you check how a page behaves across standards-based browsers; the same panel also opens with a right-click on the page and the Inspect Element option. On iPhone and iPad, the equivalent role belongs to Web Inspector: it’s turned on in Settings, under Safari, by scrolling down to the Advanced section and flipping the Web Inspector switch. On its own it does very little; its real usefulness shows up when the phone is connected to a Mac with a USB cable, because at that point the device’s name shows up in the Develop menu of Safari on the computer, from where you can inspect, remotely, the content of the page displayed on the phone’s screen. Chrome DevTools: four ways to open itChrome offers more than one route to the same set of tools. The most direct is a keyboard shortcut, though it changes between systems: on Windows, Linux, and ChromeOS, F12 or Ctrl+Shift+I open the last panel used, Ctrl+Shift+C opens the Elements panel directly, and Ctrl+Shift+J jumps straight to the Console; on Mac the same actions go through Fn+F12 or Cmd+Option+I, Cmd+Option+C, and Cmd+Option+J. Those who prefer the mouse can click the three-dot icon next to the address bar, choose More tools, then Developer tools, or right-click any element on the page and select Inspect, which opens the Elements panel straight away with that element already highlighted. A lesser-known detail is that DevTools can also open on its own: launching
Chrome from the command line with the Firefox DevTools: a toolboxFirefox groups its tools under the name DevTools, reachable from the main menu under Tools, submenu Web Developer, or with the shortcuts Ctrl+Shift+I or F12 on Windows and Linux, Cmd+Opt+I on Mac (for the Console alone, Ctrl+Shift+K, or Cmd+Opt+K on Mac, is enough). Inside, the official documentation lists a set of Core Tools: the Page Inspector for reading and editing a page’s content and layout, the Web Console for seeing messages and interacting through JavaScript, the JavaScript Debugger for pausing and stepping through running code, the Network Monitor for watching network requests as a page loads, the Performance Panel for analyzing responsiveness and performance, the Responsive Design Mode for simulating different devices and screen sizes, the Accessibility Inspector for the page’s accessibility tree, and the Application Panel for inspecting service workers and modern web applications. On top of these sit more specialized tools like Memory, Storage Inspector, DOM Property Viewer, Eyedropper, and Style Editor. Pausing at Firefox’s Debugger or Chrome’s Sources panel, and watching an algorithm run step by step, line by line, is probably the most direct way to see what a program actually does while it’s running. The same goes for web pages that run machine learning directly in the browser: they too go through the same debugging tools before they’re put online. At a glance
These panels, in the end, aren’t exclusive to phones and browsers: even very different devices, like the newest robot vacuum cleaners, hide debug modes meant for the people who design them, not for the people who run them in the living room. The logic is always the same: keep what’s needed to build a product separate from what’s needed to use it. Slide deckSlides ready to download and make your own in PowerPoint or Google Slides, with speaker notes. Pick the Flash cut or the Full one.     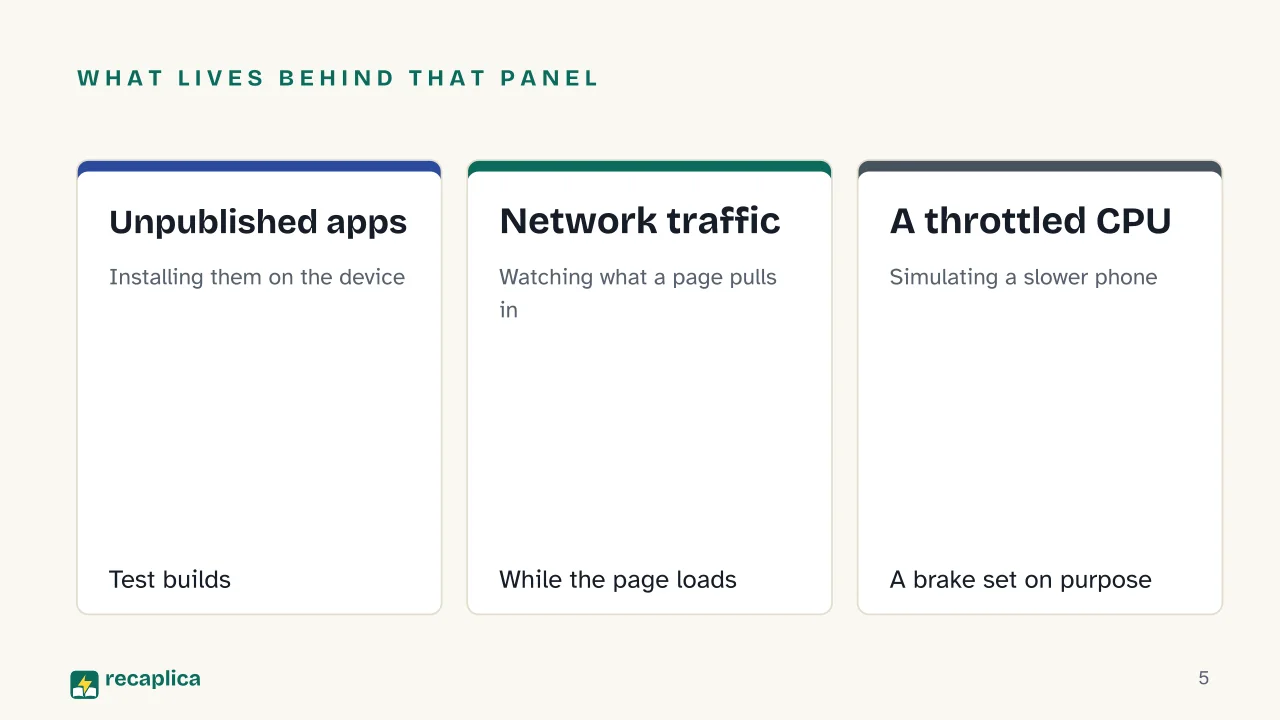  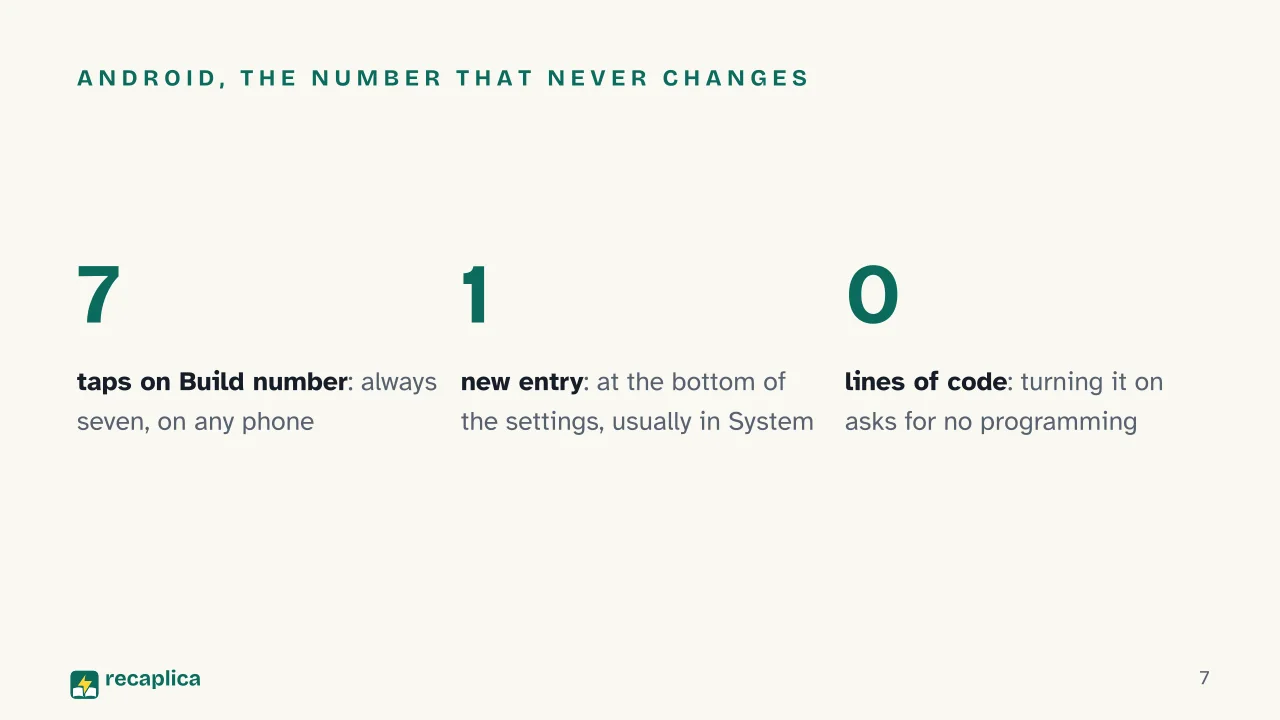 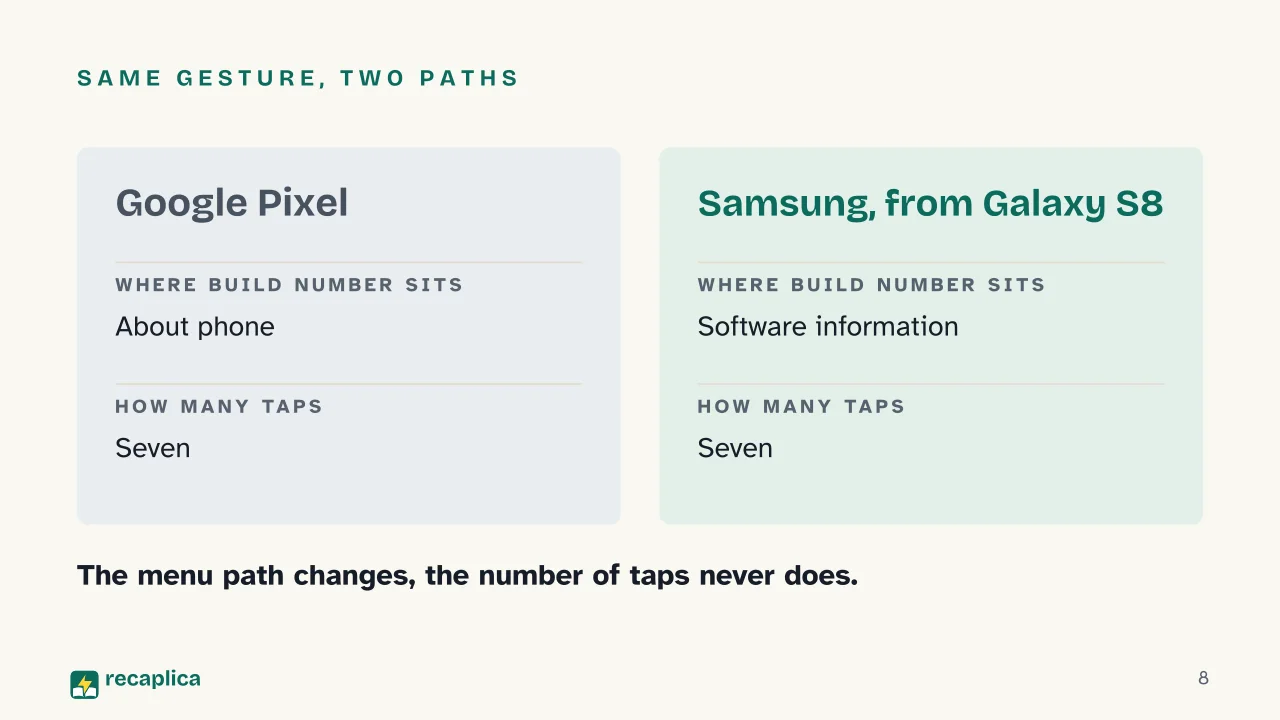 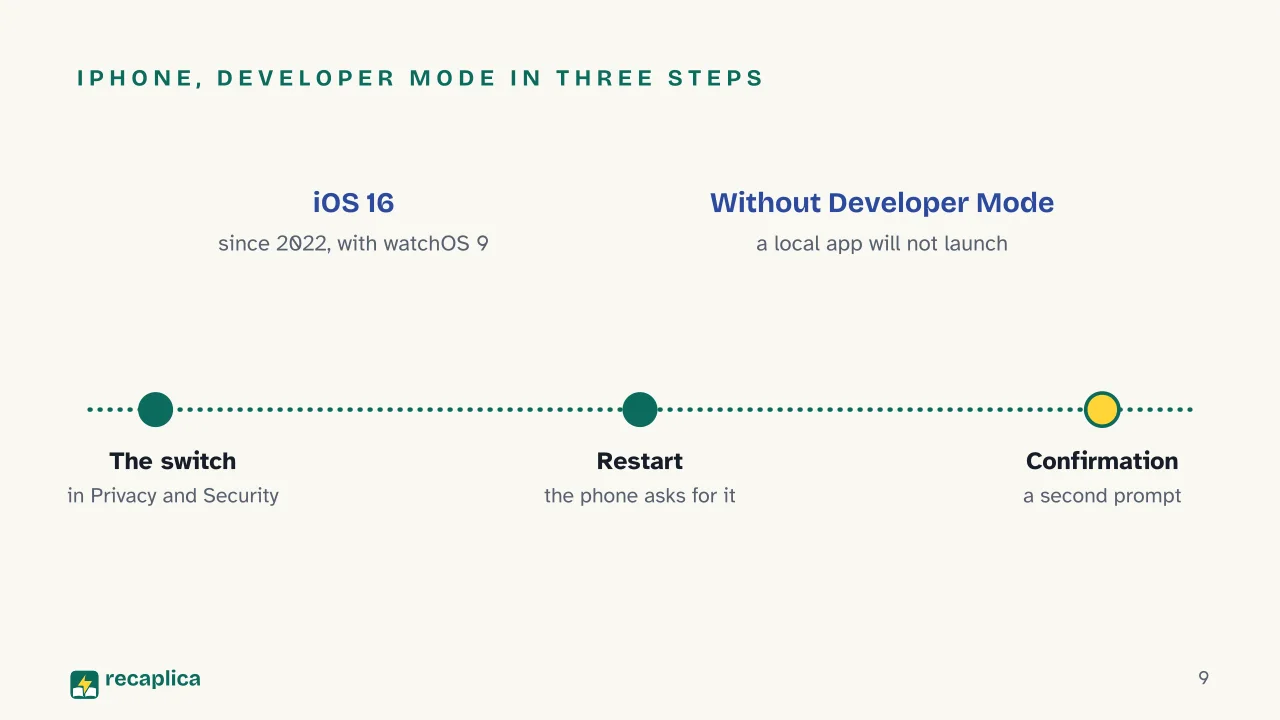  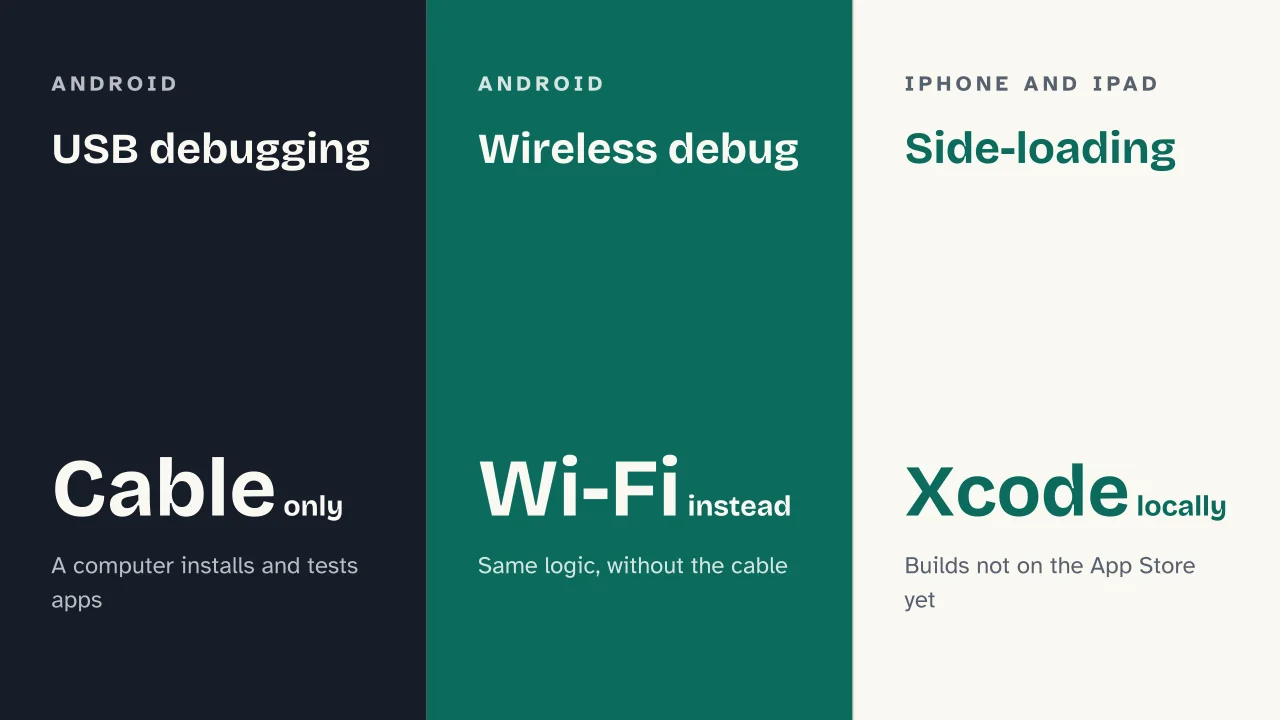  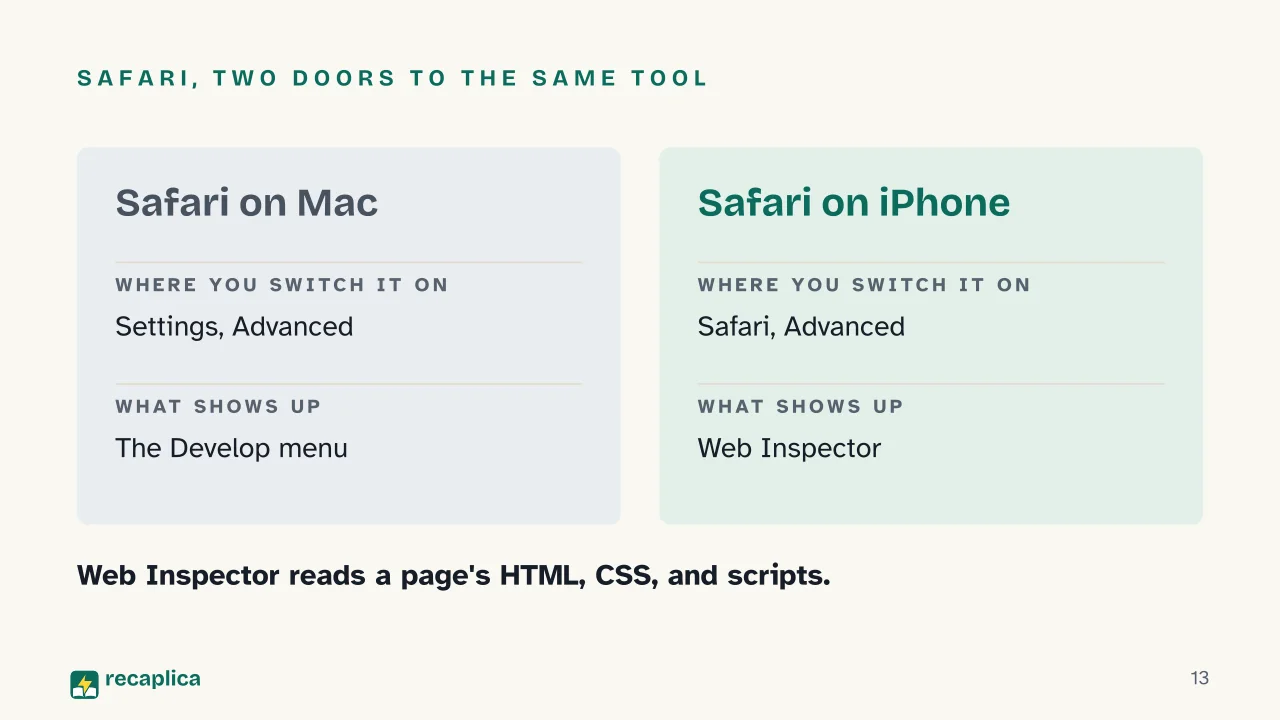 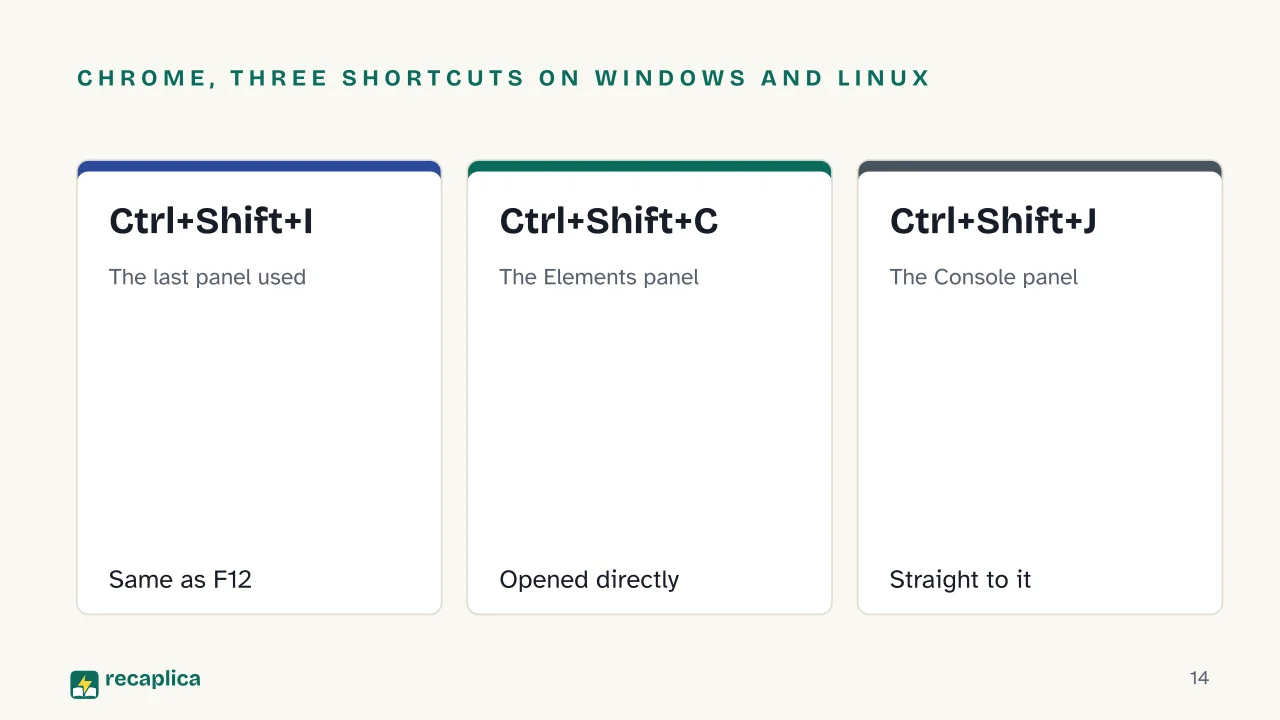 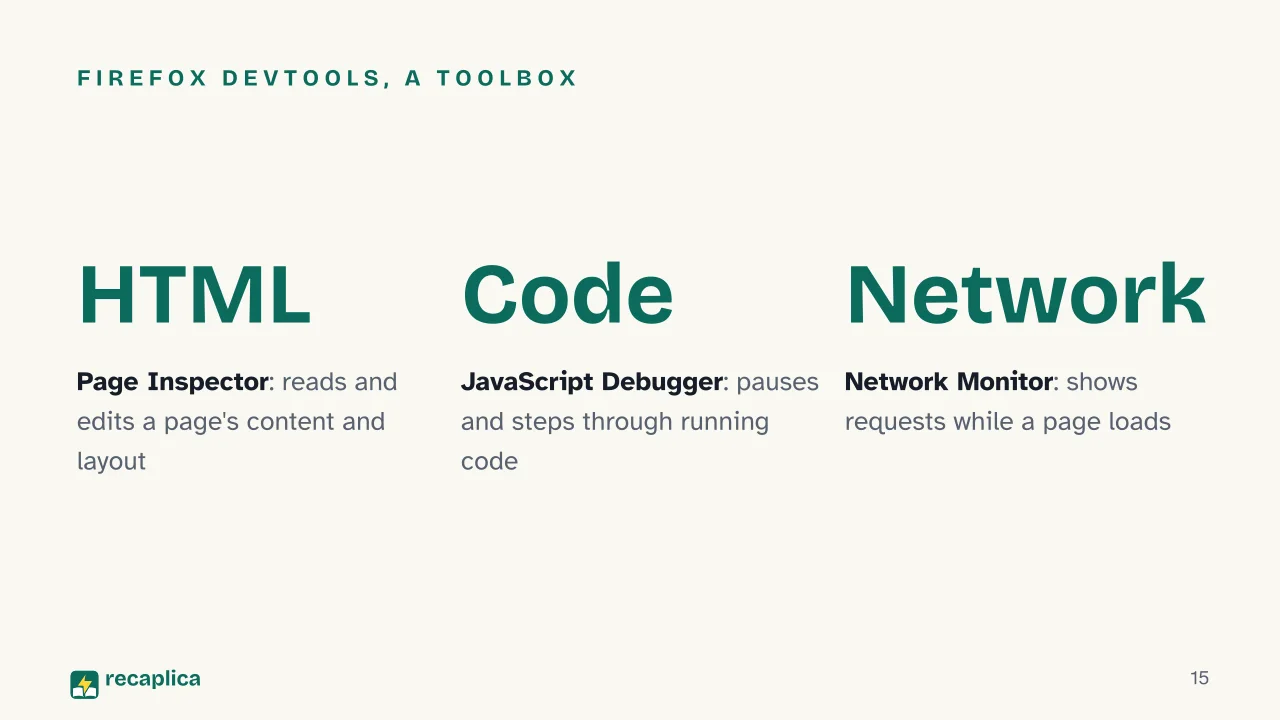  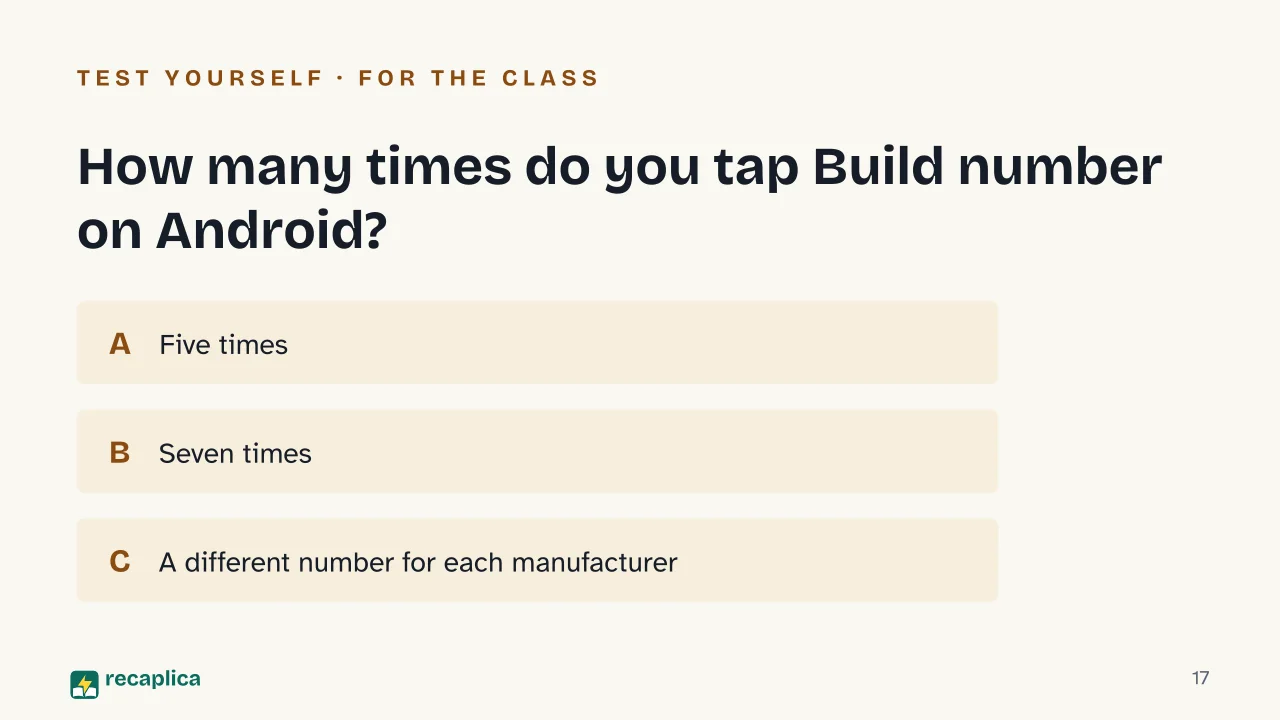  Common myths
Mind mapDrag the background to move around and the nodes to reposition them; use − and + to collapse and expand branches. 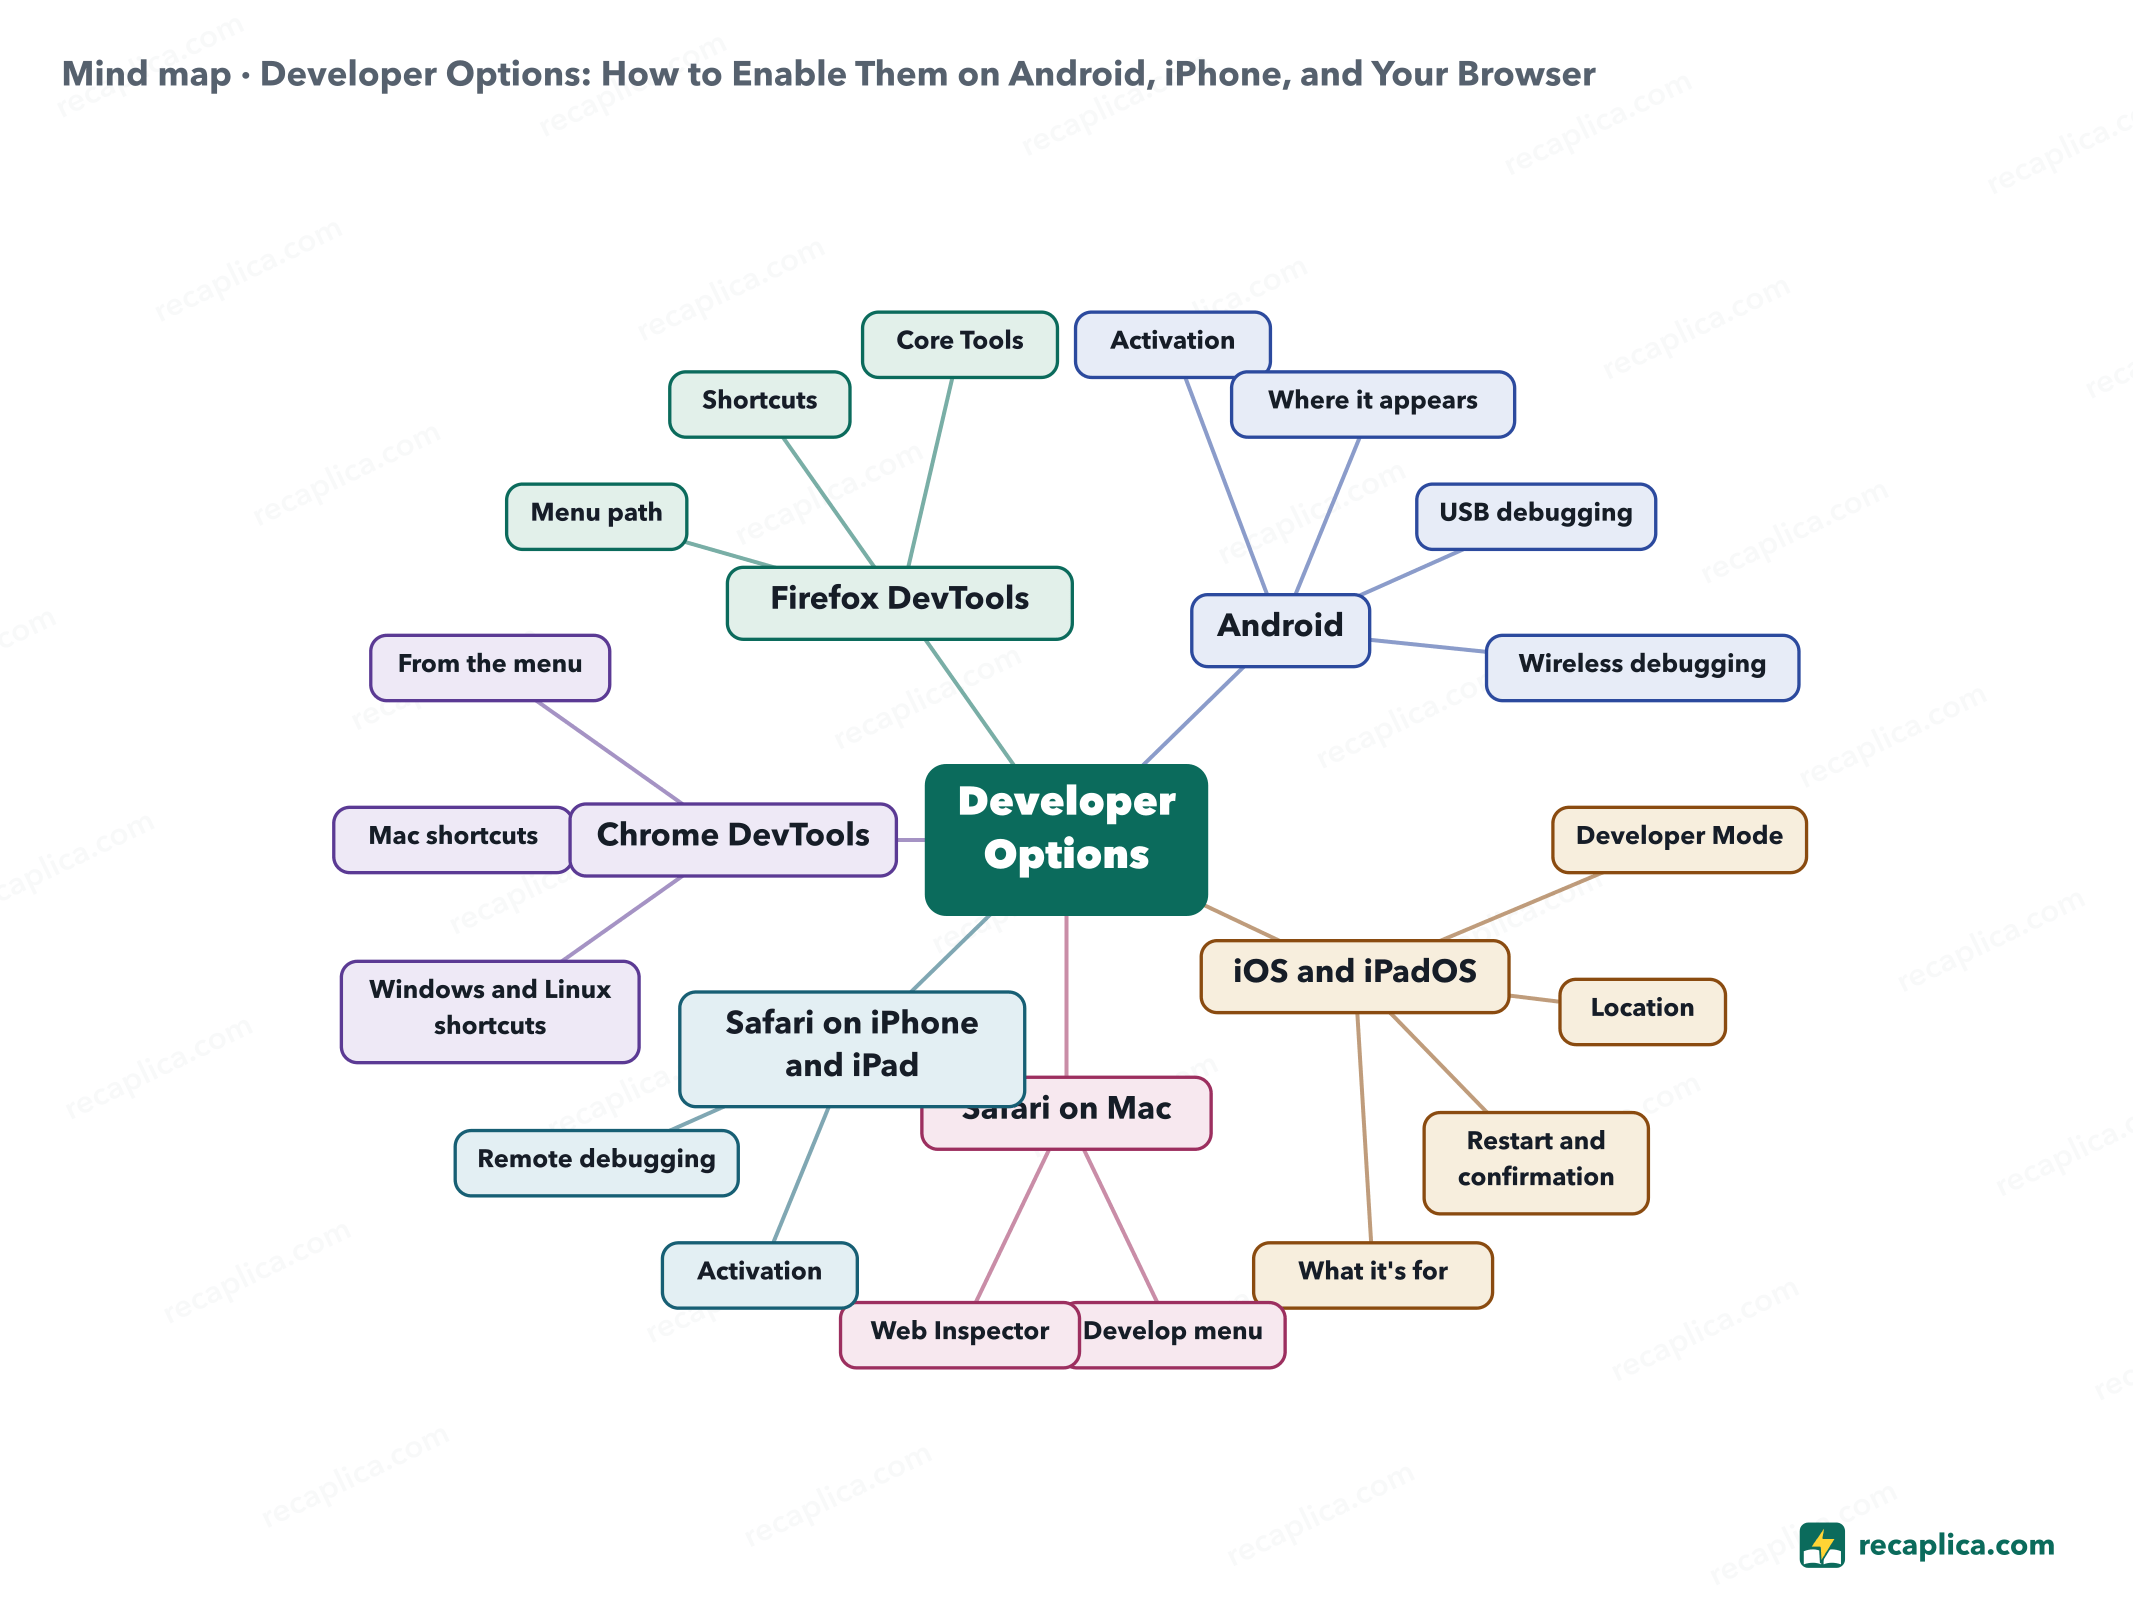
Quiz: test yourselfAnswer the questions to check what you have learned: you get instant feedback and a short explanation. Grade 0/10 0/5
FlashcardsTap the card to flip it and check whether you remember the answer, then move to the next one. 1 / 8 Explain it in your own wordsThe ultimate test: if you can explain it in simple words, you've truly understood it. Write your explanation, then compare it with the Recap. Your explanation is saved only on this device.
Frequently asked questionsDoes enabling developer options make a phone permanently less secure?No. On iPhone, activation requires a restart followed by an explicit confirmation precisely because Apple wants it to be a deliberate choice, not a switch that flips by accident; the official documentation describes it as a protection against unwanted installations, not a permanent weakening of the system. Android's dedicated support page doesn't list specific security warnings either: it only notes that the path to enable the feature changes from one model to another. Do you need to be a programmer to enable developer options?No. Turning it on only requires following a few steps in the settings menu, with no code involved. The features it unlocks afterward, like USB debugging or Web Inspector, are what's built for people who develop or test an app or a website. What is USB debugging, inside Android's developer options, used for?It's one of the features included in Developer options, and it lets a computer connected by cable communicate with the phone to install and test apps still in development. The exact path to turn it on changes with the Android version: from Android 9 onward it's under Settings > System > Advanced > Developer options > USB debugging, while on Android 7.1 and earlier the entry sits directly under Developer options. How do you inspect, from a Mac, the Safari running on a connected iPhone?First turn on Web Inspector on the iPhone, in Settings > Safari > Advanced. Then connect the device to the Mac with a USB cable: its name shows up in the Develop menu of Safari on the Mac, and from there you can inspect the web content displayed on the phone's screen. Every Recap goes through an independent review before publication. |