Skip to content
recaplica

    One moment: security check

    Cloudflare wants to make sure you're not a robot. Tick the box below and your search will continue on its own.

    IT
    recaplica Weather Forecasting: How It Works, From Data to Models to Forecasters
    © 2026 Recaplica · recaplica.com — All rights reserved
    Home › Science

    Weather Forecasting: How It Works, From Data to Models to Forecasters

    By Recaplica Newsroom · Updated on September 21, 2026

    What to print

    Page numbers appear when printing with default margins.

    Slides

    Choose a cut

    Flash10 slidesThe essential thread, to present in classFull16 slidesEvery chapter and the deeper detail

    Both come with speaker notes.

    Telegram channel
    recaplica Clear in 30 seconds, yours in 10 minutes.
    In 30 seconds Key points Deep dive Slides Myths Mind map Quiz Flashcards FAQ

    In 30 seconds quick read

    A weather forecast starts with thousands of measurements collected every day by ground stations, radar, satellites and radiosondes carried aloft by balloons. A numerical model takes that data as a starting snapshot and uses the equations of physics to calculate how the atmosphere will change hour by hour. The further out the forecast reaches, the more a tiny error in the starting data grows, which is why detailed forecasts hold up for roughly a week, while beyond 15 days large models such as the ECMWF's work only in probabilities. In the end it's still a forecaster who settles on what to communicate to the public, uncertainty included.

    Key Points

    • Forecasts start from data gathered by ground stations, radar, satellites and radiosondes
    • Radiosondes ride a balloon to over 35,000 meters, measuring pressure, temperature, humidity and wind
    • About 85% of the data feeding numerical weather models comes from polar-orbiting satellites
    • A model calculates how the atmosphere will evolve from an initial snapshot, but a small measurement error grows larger with each passing day
    • The ECMWF ensemble runs 51 parallel simulations to gauge uncertainty out to 15 days
    • The final call still belongs to a forecaster, who picks which forecast to communicate, uncertainty included

    Deep Dive

    Who watches the sky before any model does

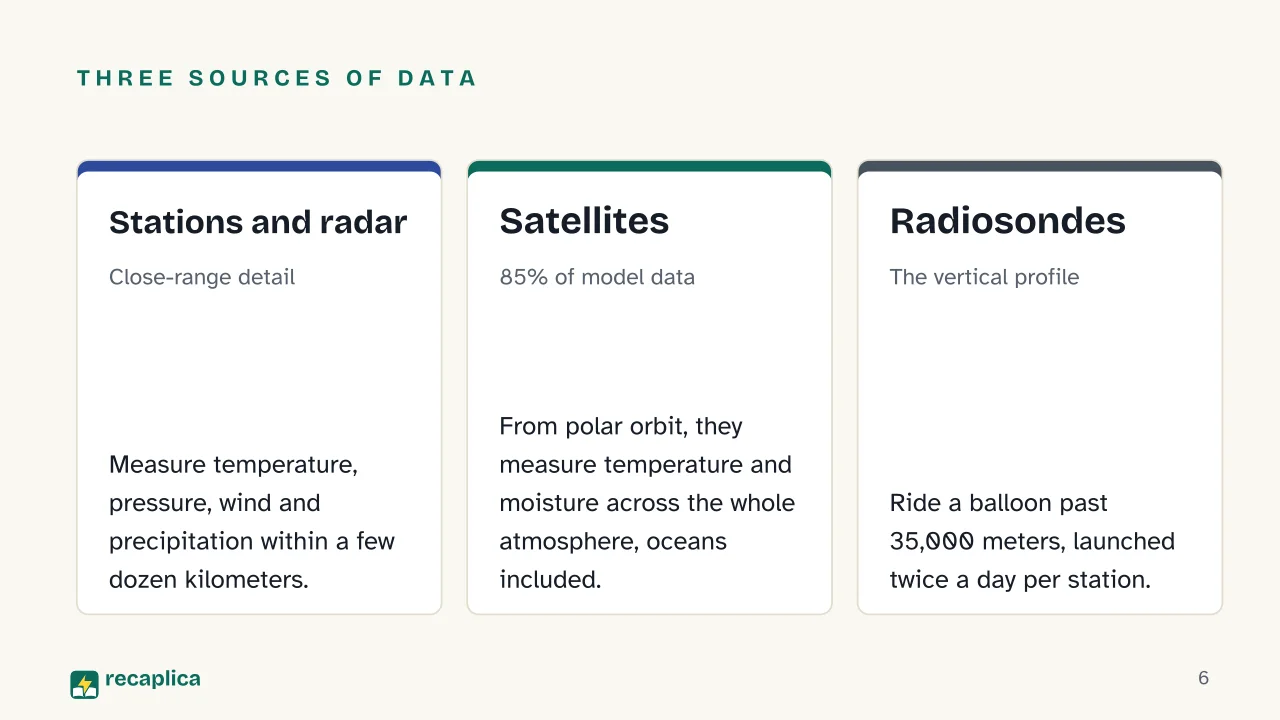
    A weather forecast starts with data, not a hunch. Every day thousands of ground stations measure temperature, pressure, wind and rainfall; radar tracks rain and storms in real time, the same kind of data behind violent events like the ones covered in how thunderstorms form or how tornadoes form. But the largest share of the data comes from above.

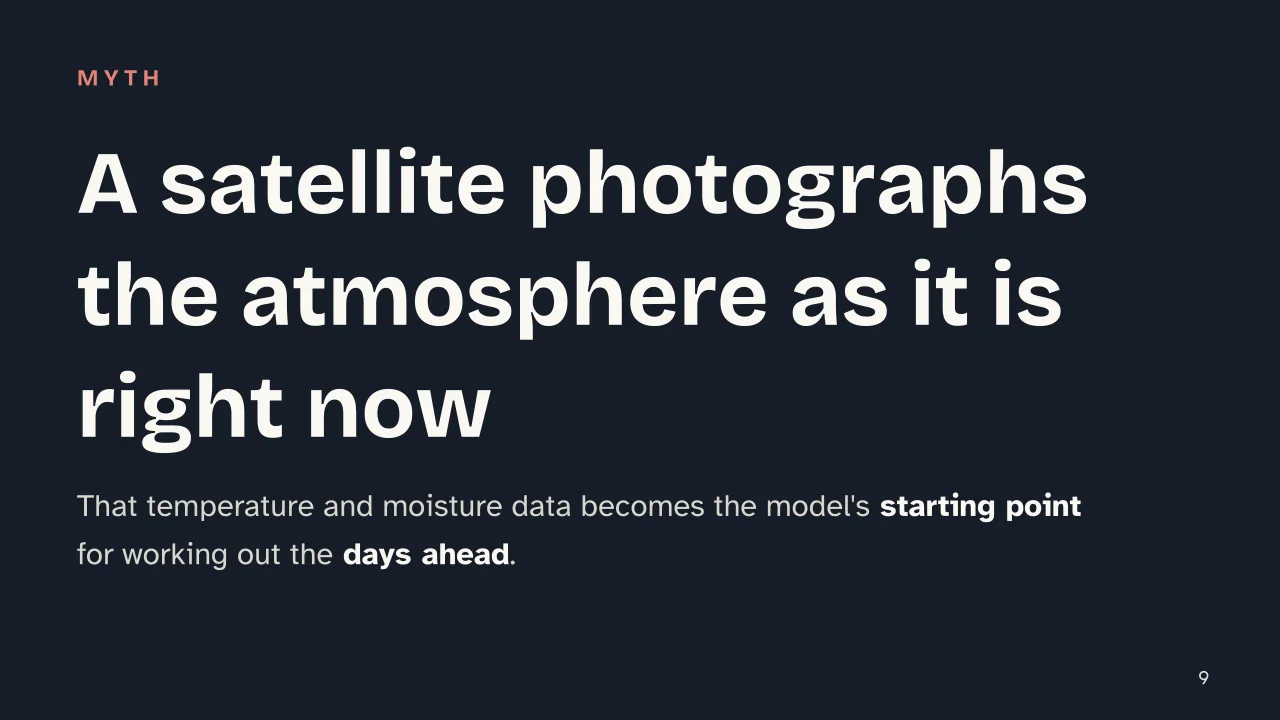
    According to NOAA/NESDIS, 85% of the data used in numerical weather models comes from polar-orbiting satellites, which measure temperature and moisture across the whole atmosphere, including over oceans where there are no ground stations. The CrIS sensor, for instance, returns detailed profiles of temperature and moisture that the model uses as a starting point.

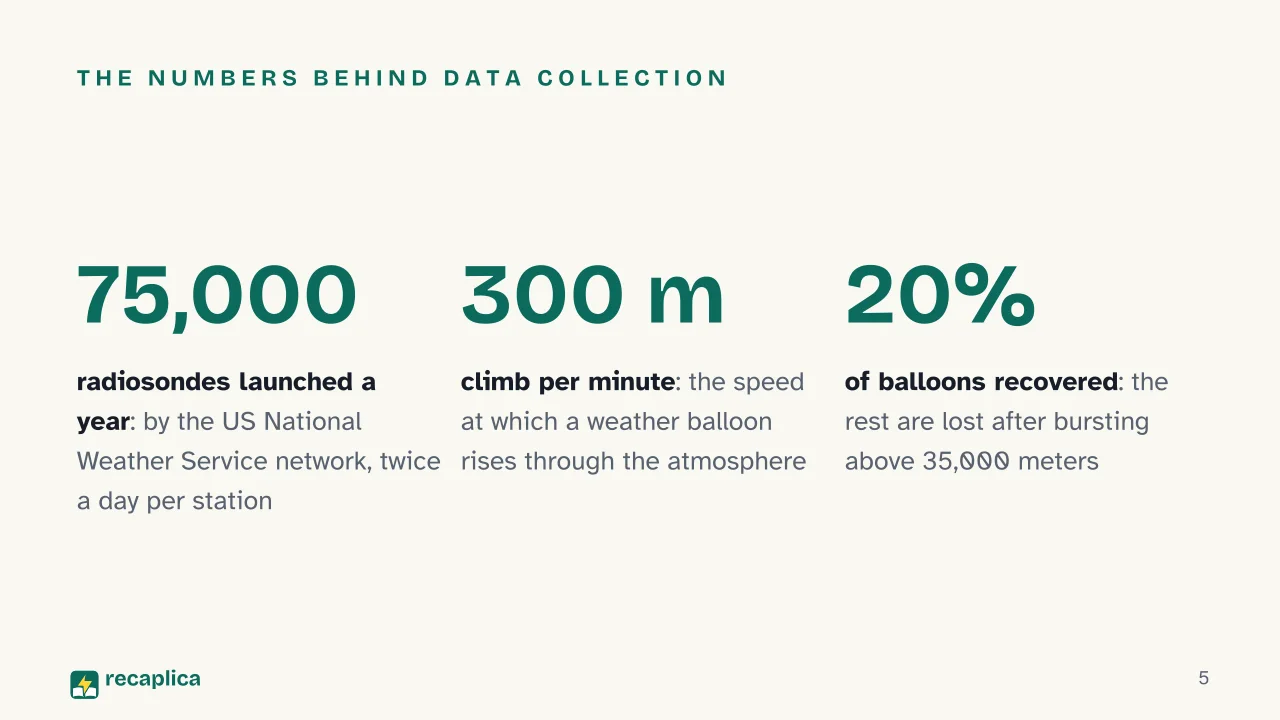
    A second kind of measurement travels from the ground upward, radiosondes. These are small instruments attached to a balloon that rises through the atmosphere, measuring pressure, temperature, humidity and wind throughout the climb. In the United States, the National Weather Service network launches roughly 75,000 a year, with two launches a day per station, at 00 and 12 UTC, the same times the large global models, including the ECMWF’s, are initialized.

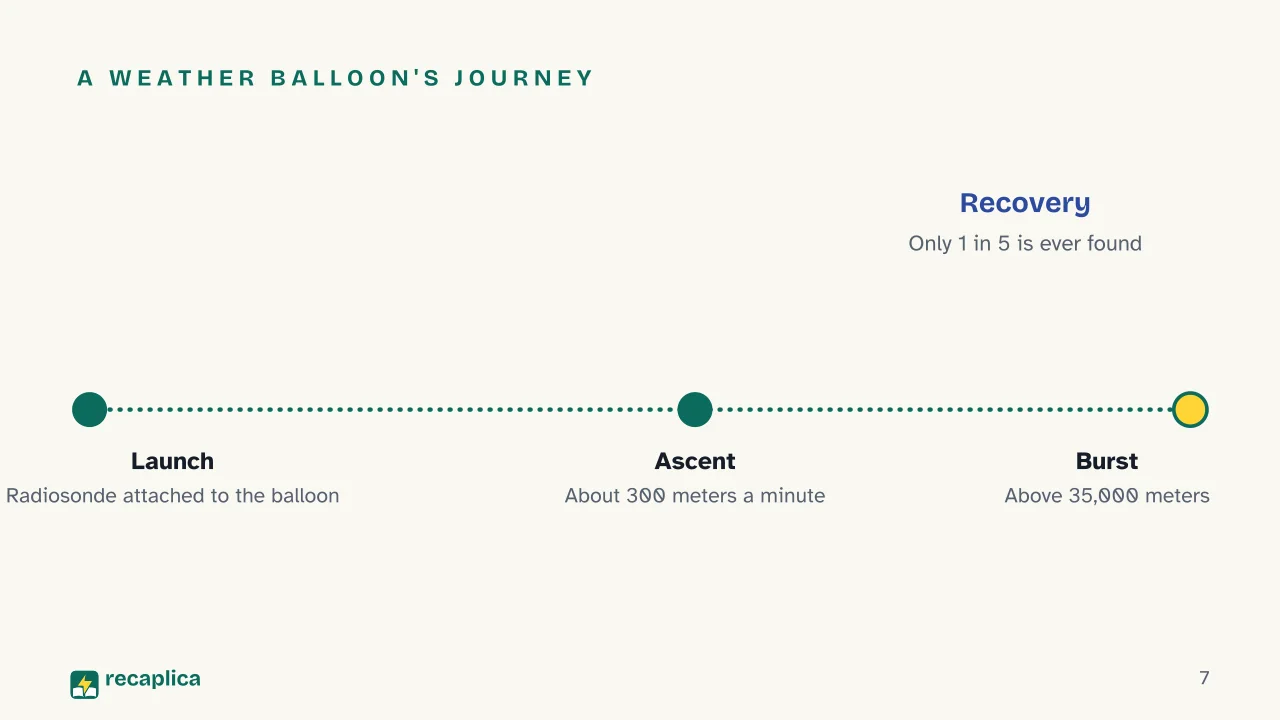
    Practical example: a weather balloon launched at 00 UTC climbs at roughly 300 meters a minute and can pass 35,000 meters before bursting as the pressure drops. Only about 20% of balloons are ever recovered; the rest are lost, but their job is already done the moment they finish transmitting data on the way up.

    From data to model

    With thousands of measurements collected within a few hours, a computer builds a snapshot of the atmosphere’s state at that exact moment, temperature, pressure, humidity and wind at every point of a grid, from the surface up through the higher layers. Starting from that snapshot, a numerical model applies the equations of physics that describe how air moves, how it heats up and how water vapor condenses, and calculates how that snapshot will change hour by hour.

    The catch is that the starting snapshot is never perfect. ECMWF’s own training material on predictability explains the idea with a simple example: in a system governed by entirely deterministic equations, a tiny difference at the starting point, in the example given a value of 0.4 versus 0.4001, leads to completely different outcomes after just a few dozen steps. The atmosphere behaves the same way, a small measurement error today becomes an enormous one ten days later. That’s why the ECMWF states that, in practice, detailed forecasts hold up for about a week.

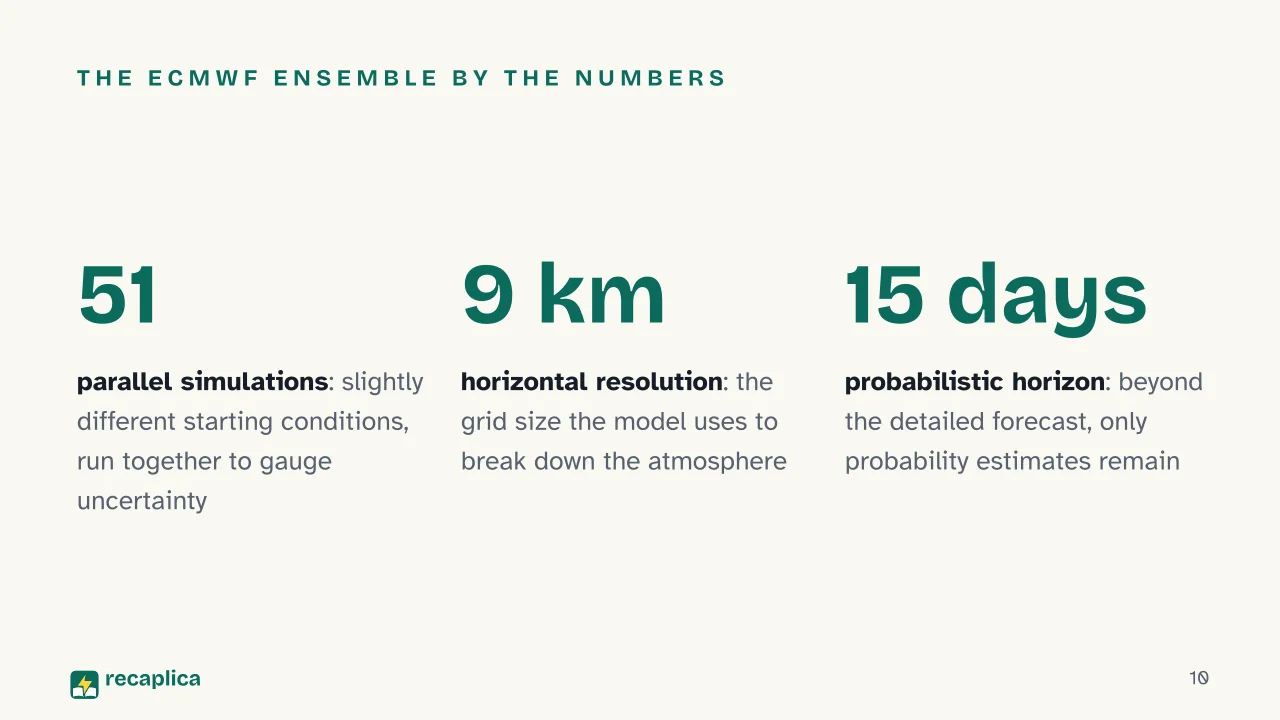
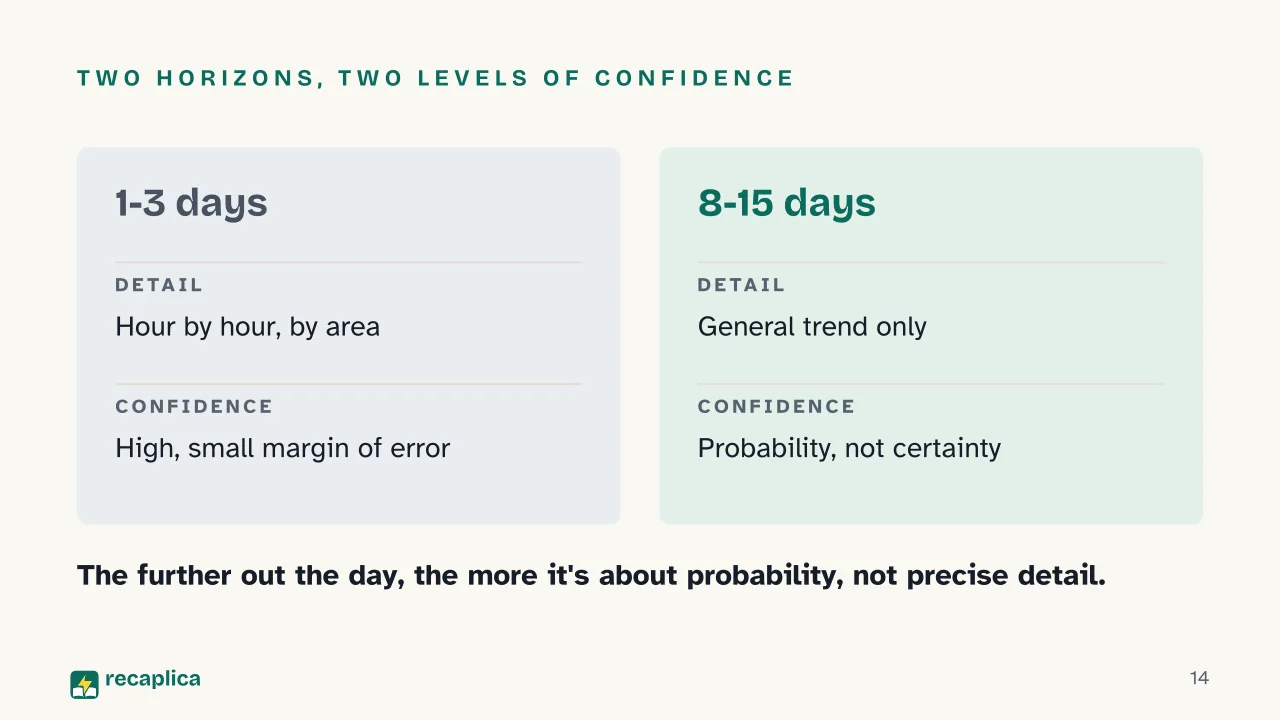
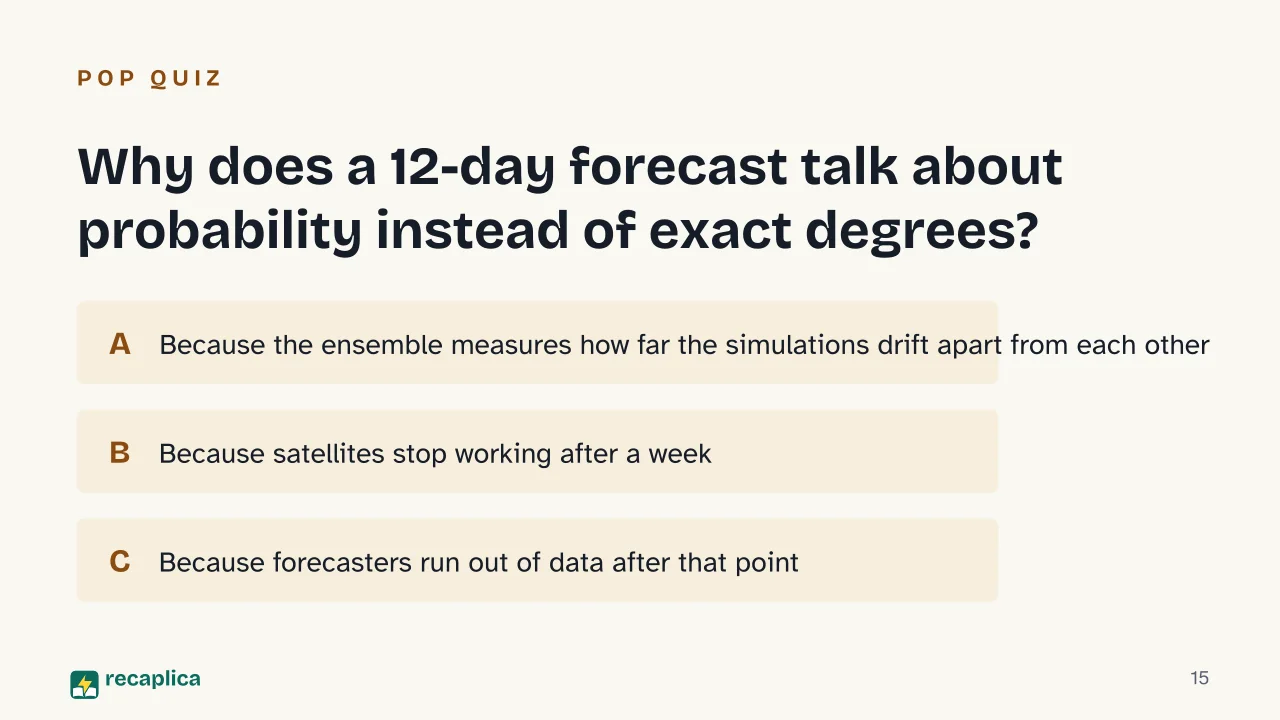
    To push past that limit without pretending to a precision that doesn’t exist, forecasting centers turn to ensembles. Instead of running a single forecast, the ECMWF runs 51 in parallel, each with slightly different starting conditions and a resolution of about 9 kilometers. If the 51 runs stay close together, uncertainty is low; if they spread out widely, the forecast flags itself as less reliable. That’s how forecasts out to 15 days work: not hour-by-hour detail, but a probability, say a 60% chance of rain in a given area.

    RangeWhat kind of forecast it givesWhy
    1-3 daysHour-by-hour detail by area, usually reliableErrors in the starting data haven’t had time to grow yet
    4-7 daysGeneral trend, less detailThe practical limit the ECMWF cites for detailed forecasting
    8-15 daysOnly the probability of a scenario, never a precise hourly figureThe 51-member ensemble shows how much the runs have diverged

    The part the model can’t do on its own

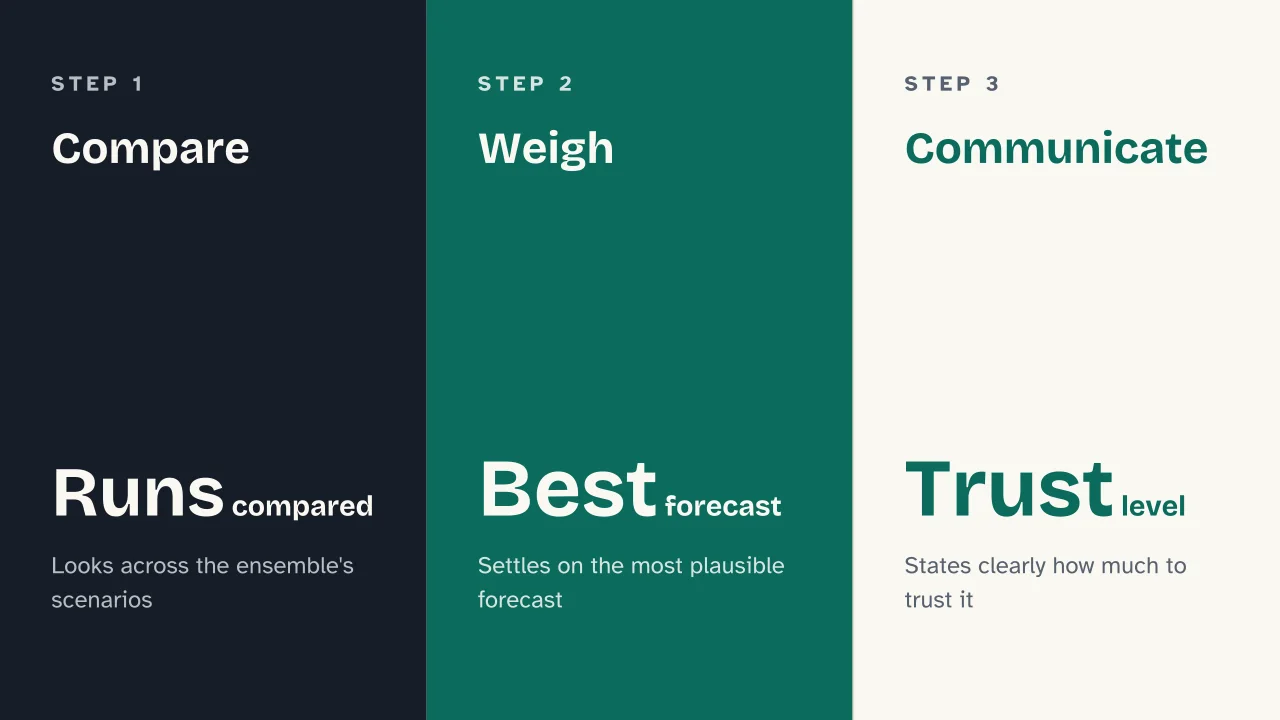
    Numerical models don’t come out ready for the evening news. A forecaster compares the output of several models and the ensemble results, spots where they agree and where they don’t, and decides which scenario to communicate, with what margin of doubt. It’s the same reason a heat wave, like the ones covered in heat waves: how they form, gets announced days in advance but with varying confidence depending on how well the models agree with each other.

    The European body that produces much of this forecasting, the ECMWF (European Centre for Medium-Range Weather Forecasts), is an international organization running around the clock, with about 500 staff across its sites in Reading, in the United Kingdom, Bologna and Bonn. Understanding how the atmosphere exchanges energy with the surface also helps make sense of longer-term phenomena, like those described in the greenhouse effect: what it is and how it works: the same underlying physics, applied over timescales far longer than a weekly forecast.

    Slide deck

    Slides ready to download and make your own in PowerPoint or Google Slides, with speaker notes. Pick the Flash cut or the Full one.
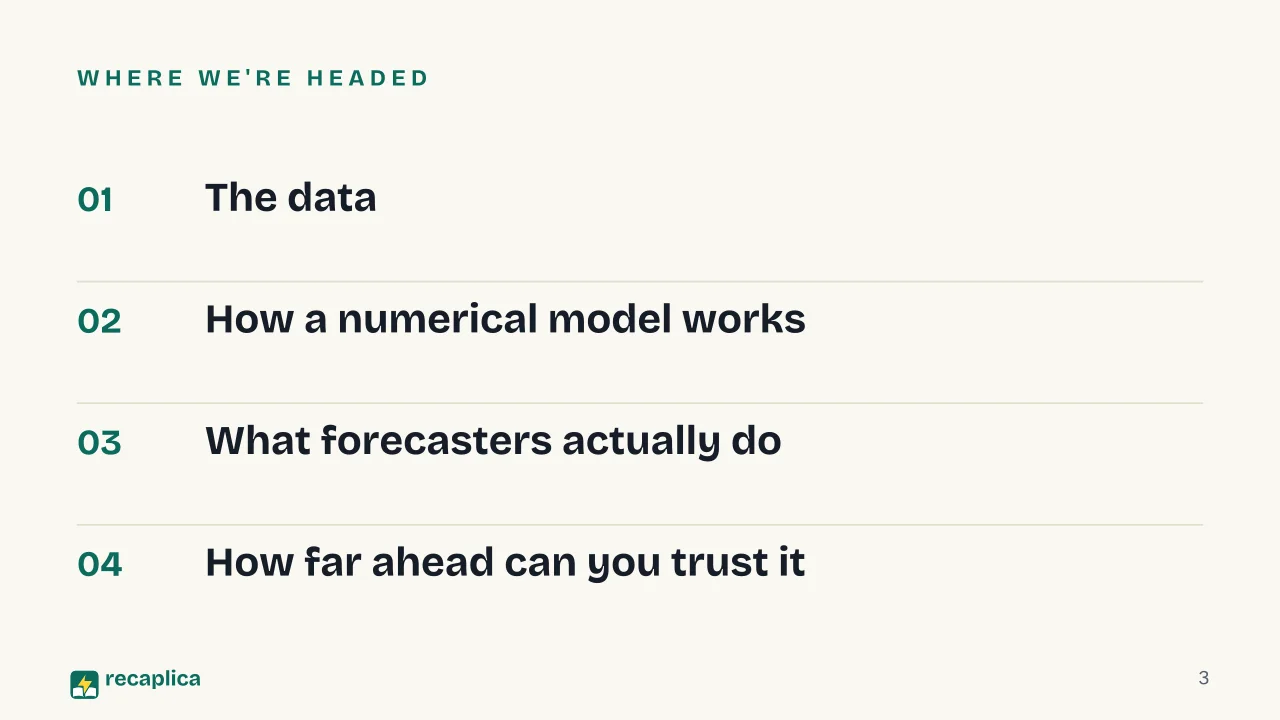
    Slide 1 of the presentation on Weather Forecasting: Weather ForecastingSlide 2 of the presentation on Weather Forecasting: How do they know it's going to rain?Slide 3 of the presentation on Weather Forecasting: Where we're headedSlide 4 of the presentation on Weather Forecasting: Chapter 01: The dataSlide 5 of the presentation on Weather Forecasting: The numbers behind data collectionSlide 6 of the presentation on Weather Forecasting: Three sources of data: Stations and radar, Satellites, RadiosondesSlide 7 of the presentation on Weather Forecasting: A weather balloon's journeySlide 8 of the presentation on Weather Forecasting: Chapter 02: How a numerical model worksSlide 9 of the presentation on Weather Forecasting: A satellite photographs the atmosphere as it is right nowSlide 10 of the presentation on Weather Forecasting: The ECMWF ensemble by the numbersSlide 11 of the presentation on Weather Forecasting: Chapter 03: What forecasters actually doSlide 12 of the presentation on Weather Forecasting: Compare · Weigh · CommunicateSlide 13 of the presentation on Weather Forecasting: Chapter 04: How far ahead can you trust itSlide 14 of the presentation on Weather Forecasting: Two horizons, two levels of confidenceSlide 15 of the presentation on Weather Forecasting: Why does a 12-day forecast talk about probability instead of exact degrees?Slide 16 of the presentation on Weather Forecasting: The Recap continues here
    Flash10 slidesThe essential thread, to present in classFull16 slidesEvery chapter and the deeper detail

    Common myths

    • ✗ Myth A weather satellite shows what the sky will look like in advance

      ✓ Reality A satellite measures the atmosphere's temperature and moisture right now, not a picture of the future. NOAA/NESDIS puts that data at 85% of everything feeding numerical weather models, which then calculate how conditions will evolve using the equations of physics.

    • ✗ Myth A weather balloon broadcasts the forecast live as it climbs

      ✓ Reality The balloon carries a radiosonde that measures pressure, temperature, humidity and wind on the way up, then bursts above 35,000 meters. Those readings feed the model afterward; they are not a forecast in themselves.

    • ✗ Myth If a model gets it wrong past 10 days, the weather simply can't be predicted that far out

      ✓ Reality Past the roughly week-long limit the ECMWF cites for detailed forecasts, models don't stop working, they switch to probabilities. The 51-member ensemble tells you how much to trust a scenario instead of handing you a single hard number.

    Mind map

    Drag the background to move around and the nodes to reposition them; use − and + to collapse and expand branches.
    Customize
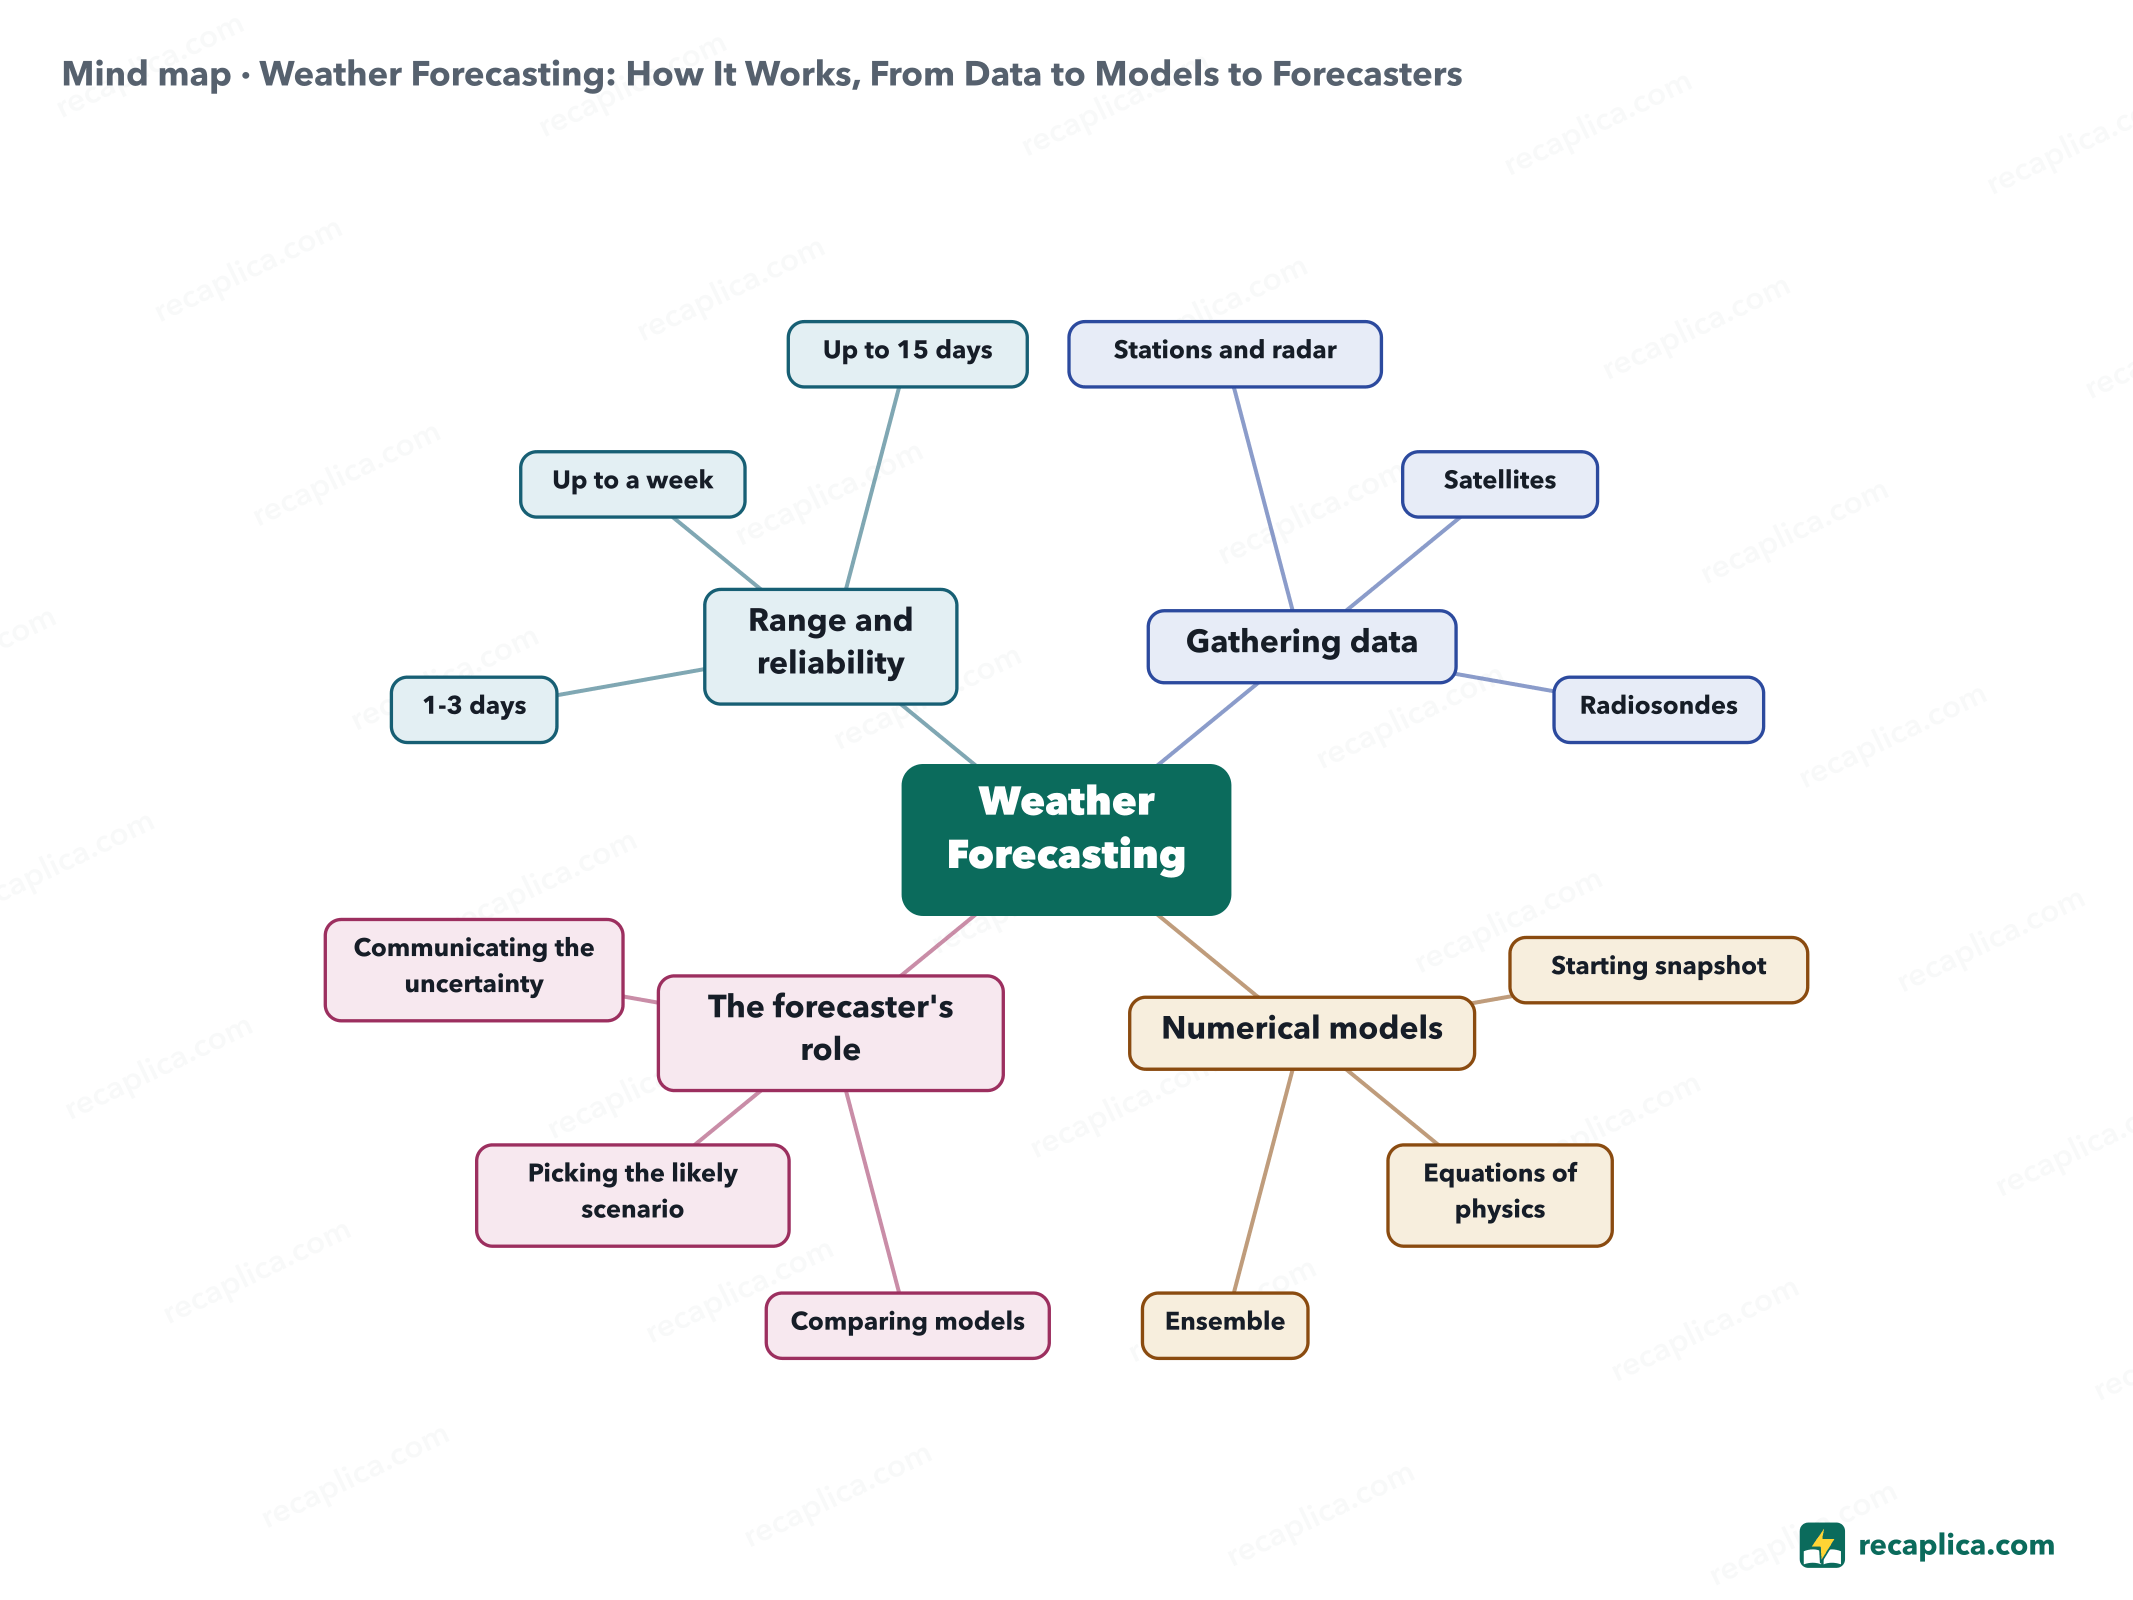
    Mind map: Weather Forecasting: How It Works, From Data to Models to Forecasters
    • Weather Forecasting
      • Gathering data
        • Stations and radar Ground-level readings within a few dozen kilometers
        • Satellites 85% of model data, from polar orbit
        • Radiosondes Weather balloons, two launches a day per station
      • Numerical models
        • Starting snapshot The atmosphere's measured state at one moment
        • Equations of physics Calculate how the atmosphere will change over time
        • Ensemble 51 parallel simulations to gauge uncertainty
      • The forecaster's role
        • Comparing models
        • Picking the likely scenario
        • Communicating the uncertainty
      • Range and reliability
        • 1-3 days Hour-by-hour detail, high reliability
        • Up to a week Practical limit for detailed forecasts, per the ECMWF
        • Up to 15 days Probabilities only, via the ensemble

    Quiz: test yourself

    Answer the questions to check what you have learned: you get instant feedback and a short explanation.

    Grade 0/10 0/5
    1 What does a radiosonde measure as it rises through the atmosphere on a balloon?

    NWS radiosondes measure all four of these throughout the ascent, up to over 35,000 meters.

    2 How many times a day does a typical NWS station launch a radiosonde?

    Launches usually happen at 00 and 12 UTC, the same times the large numerical models are initialized.

    3 According to NOAA/NESDIS, roughly what share of the data used in numerical weather models comes from polar-orbiting satellites?

    NESDIS puts the figure at 85% for satellite data feeding numerical weather prediction models.

    4 What is the ECMWF's 51-simulation ensemble used for?

    If the 51 runs stay close together, uncertainty is low; if they spread out, the forecast should be treated with more caution.

    5 True or false: a weather satellite shows a direct image of the weather a week from now

    A satellite measures the atmosphere's temperature and moisture in the present; those are inputs the model uses to calculate how conditions will change over the following days.

    Answers: 1-A · 2-B · 3-C · 4-A · 5-B

    Flashcards

    Tap the card to flip it and check whether you remember the answer, then move to the next one.

    1 / 8

    Explain it in your own words

    The ultimate test: if you can explain it in simple words, you've truly understood it. Write your explanation, then compare it with the Recap.

    Your explanation is saved only on this device.

    A weather forecast starts with thousands of measurements collected every day by ground stations, radar, satellites and radiosondes carried aloft by balloons. A numerical model takes that data as a starting snapshot and uses the equations of physics to calculate how the atmosphere will change hour by hour. The further out the forecast reaches, the more a tiny error in the starting data grows, which is why detailed forecasts hold up for roughly a week, while beyond 15 days large models such as the ECMWF's work only in probabilities. In the end it's still a forecaster who settles on what to communicate to the public, uncertainty included.

    Frequently asked questions

    How do forecasters actually predict the weather?

    They gather atmospheric data from ground stations, satellites and radiosondes, feed it into numerical models that simulate how the atmosphere will evolve using the equations of physics, then a forecaster weighs how much to trust the result before sharing it.

    Why are long-range forecasts less reliable?

    Because the atmosphere is a system where small differences in the starting data grow over time. Past the roughly week-long practical limit the ECMWF cites, hour-by-hour detail loses accuracy, though probability-based forecasts stay useful out to 15 days.

    What is a weather balloon and what is it for?

    It's a balloon that carries a radiosonde, an instrument measuring pressure, temperature, humidity and wind, up past 35,000 meters. The readings collected during the climb feed into forecast models.

    Do weather satellites show what the weather will actually be?

    No, they measure the atmosphere's temperature and moisture in the present. That data is an input for the models, which then calculate how conditions will change over the following days.

    What is an ensemble forecast in meteorology?

    It's a group of simulations launched in parallel from slightly different starting conditions. If they agree, the forecast is more trustworthy; if they diverge widely, uncertainty is high.

    Sources

    • Frequently Asked Question about Radiosonde Data Quality, National Weather Service
    • Virtual Tour, Weather Balloon Launch, National Weather Service
    • Numerical Weather Prediction and Critical Weather Applications Initiative, NESDIS/NOAA
    • Introduction to chaos, predictability and ensemble forecasts, ECMWF
    • Medium-range forecasts, ECMWF
    • About ECMWF

    Every Recap goes through an independent review before publication.

    Every evening, the day's new Recaps on our Telegram channel. Join the channel →

    Keep learning

    • Science How Thunderstorms Form: From Warm Air to Lightning A thunderstorm forms when warm, moist air near the ground gets pushed upward, meets unstable air, and keeps rising until it builds a towering cloud, the cumulonimbus. It goes through three stages: developing, then mature, and finally dissipating. A single storm cell typically lasts 30 to 60 minutes, while the whole process takes about an hour. The mature stage is also the most dangerous: updrafts and downdrafts coexist and bring heavy rain, hail, strong wind, and lightning; if the updraft starts rotating because of winds that shift with height, a supercell forms, the longest-lived storm type, and the one most associated with the most violent tornadoes. Some storms, instead of fading away, keep regenerating over the same spot for hours, dumping persistent rain. Read the Recap →
    • Science How Tornadoes Form: From Thunderstorm to Funnel A tornado is a violently rotating column of air that touches both the ground and the cloud it hangs from at the same time. The most violent and destructive tornadoes almost always form inside a supercell, a thunderstorm that rotates internally thanks to a circulation called a mesocyclone. The usual ingredients are moisture, atmospheric instability, a lifting mechanism and wind shear, meaning a change in wind direction and speed with height: together they generally raise the odds of a vortex forming, but they never guarantee one. The funnel does not descend from the cloud like a stretching limb; it forms near the ground and builds upward, and even after decades of research scientists still don't have a complete picture of exactly what turns a mesocyclone into a tornado. Read the Recap →
    • Science Summer: Why It Happens, When It Starts and How Heat Affects the Body Summer is the hottest season of the year, falling between spring and autumn, and it exists because of the tilt of Earth's axis, not because the planet moves closer to the Sun: during the Northern Hemisphere's summer, Earth is actually at the farthest point in its orbit from the Sun. Its astronomical marker is the summer solstice, the day with the most hours of daylight and the shortest night of the year, which falls around June 21 in the Northern Hemisphere and about six months later in the Southern Hemisphere. Heat fuels thunderstorms and heat waves, phenomena that cities make worse through the urban heat island effect. Intense heat puts the most strain on the human body's cardiovascular system, and the resulting mortality risk falls disproportionately on older adults, young children and people with chronic conditions. Read the Recap →

    recaplica

    Clear in 30 seconds, yours in 10 minutes.

    Recaps Mind maps Request a Recap Telegram channel Mind map maker Our method About Privacy & cookies Legal notes & terms of use

    © 2026 Recaplica · A project by Curi S.r.l. — VAT IT05472000750

    Statistics, only if you say so

    To learn which Recaps help most we would use Google Analytics, with aggregate, anonymous data. It starts only with your OK, and you can change your mind anytime. Privacy policy