Skip to content
recaplica

    One moment: security check

    Cloudflare wants to make sure you're not a robot. Tick the box below and your search will continue on its own.

    IT
    recaplica Heat Waves: How They Form and What Fuels Them
    © 2026 Recaplica · recaplica.com — All rights reserved
    Home › Science

    Heat Waves: How They Form and What Fuels Them

    By Recaplica Newsroom · Updated on September 5, 2026

    What to print

    Page numbers appear when printing with default margins.

    Slides

    Choose a cut

    Flash10 slidesThe essential thread, to present in classFull17 slidesEvery chapter and the deeper detail

    Both come with speaker notes.

    Telegram channel
    recaplica Clear in 30 seconds, yours in 10 minutes.
    In 30 seconds Key points Figures Deep dive Slides Myths Mind map Quiz Flashcards FAQ

    In 30 seconds quick read

    A heat wave is a period of weather that is warmer than average for a given place and time of year: there is no single temperature threshold that applies everywhere. The most common mechanism is a high-pressure system that stalls over a region for days or weeks, blocking cooler air from moving in; the air sinking inside it compresses and warms, an effect behind the so-called "heat domes". Local factors such as dry soil and cities, which hold onto more heat than open countryside, can add to the effect. Global warming does not create a heat wave on its own, but it raises the starting temperature and makes extreme values more likely.

    Key Points

    • There is no single threshold: every region defines a heat wave against its own usual climate.
    • The most frequent trigger is a blocking high, an area of high pressure that stays in place for days or weeks.
    • Air sinking at the centre of the block compresses and warms (subsidence): this is the mechanism behind so-called "heat domes".
    • Dry soil, the urban heat island, and heat carried in from water vapour condensing far away can all amplify an event already under way.
    • Climate change does not generate blocking highs by itself, but it raises the starting baseline and makes records more likely.
    • The 1976 British summer and the 2021 North American heat dome show similar mechanisms with very different outcomes.

    Key figures

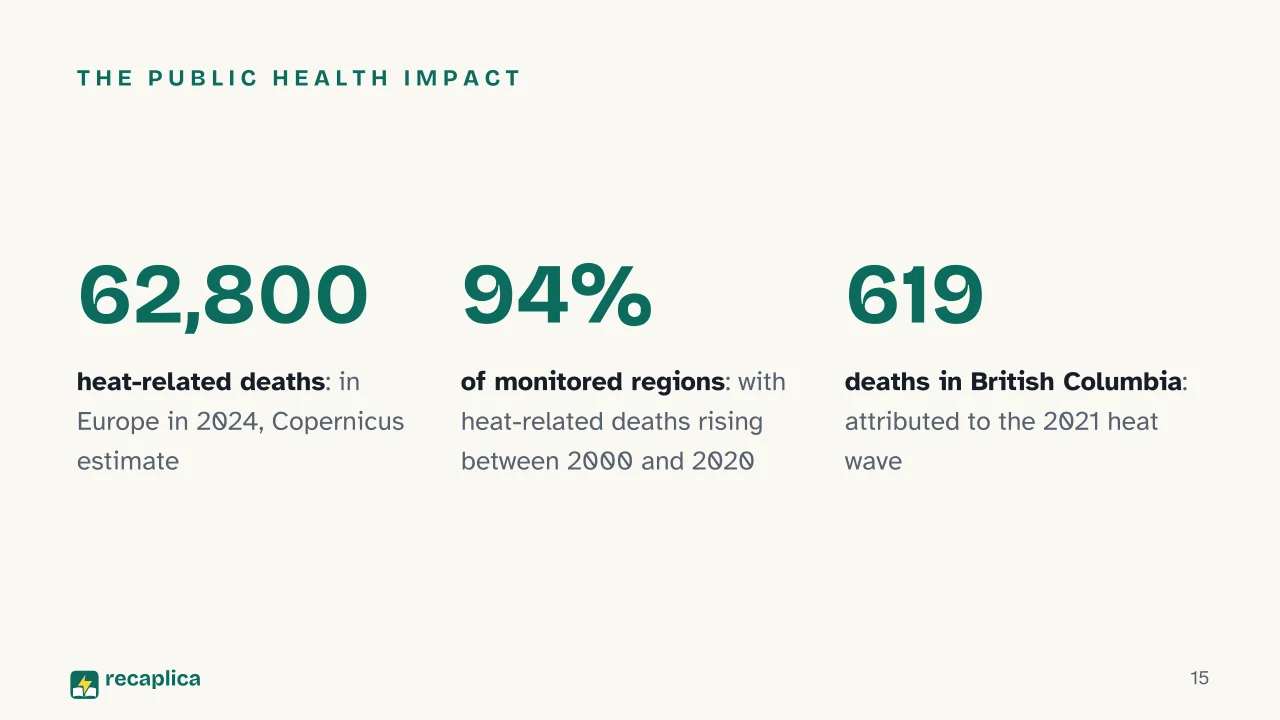
    • 62,800 estimated heat-related deaths in Europe in 2024 Source: Copernicus Climate Change Service
    • 49.6°C temperature record set in Lytton, Canada, in June 2021 Source: Carbon Brief
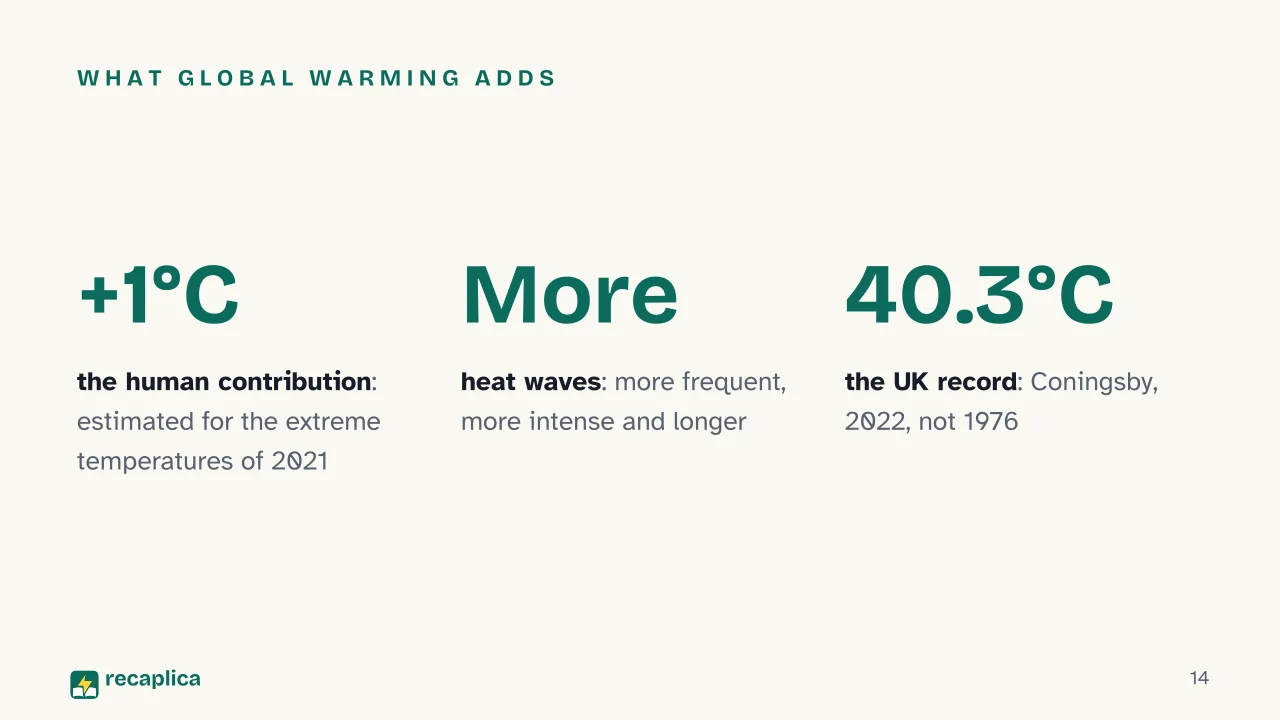
    • 40.3°C the United Kingdom's all-time temperature record, Coningsby, 2022 Source: Met Office

    Deep Dive

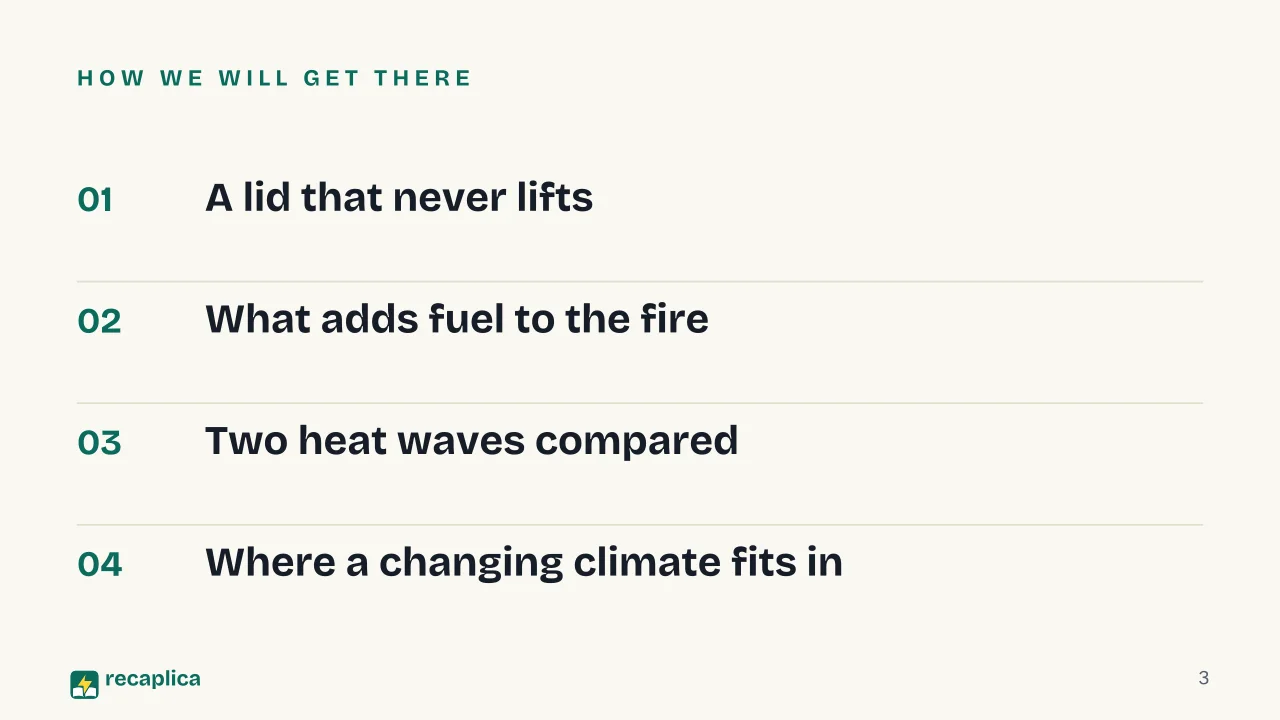
    A lid that never lifts

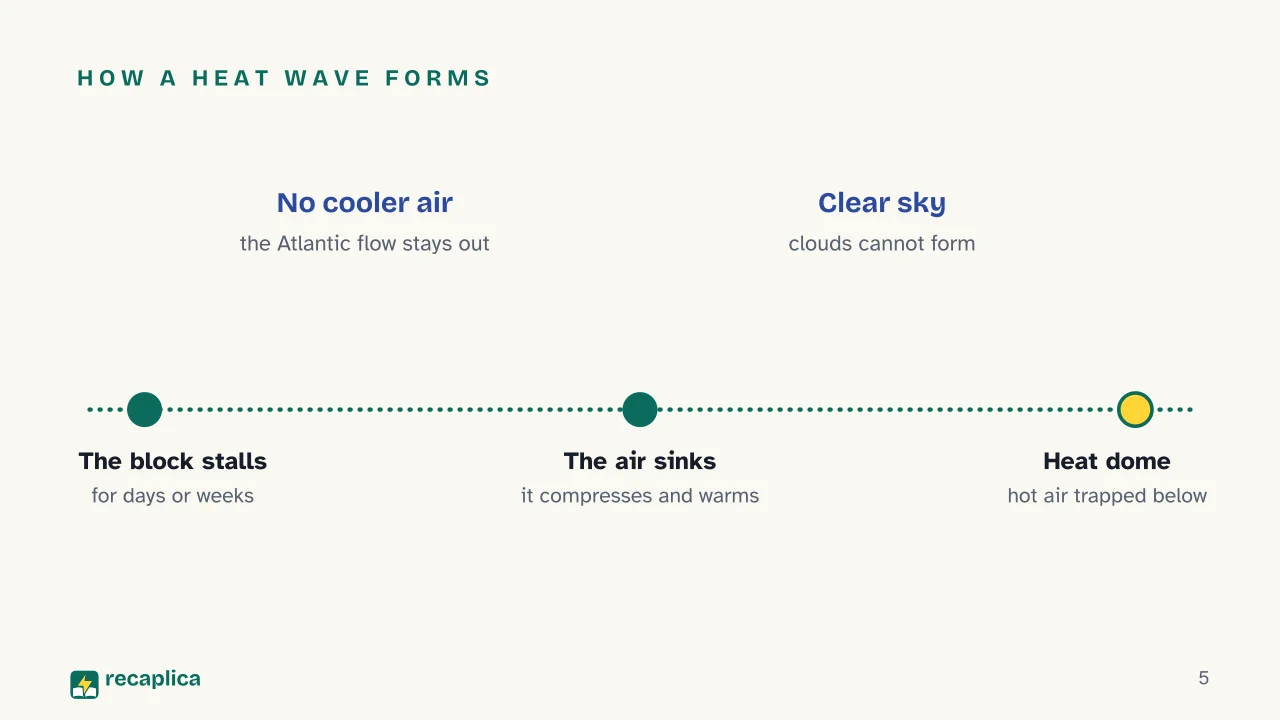
    Intense heat on its own is not enough to make a heat wave. Something has to hold it in place over a region long enough for it to build up, and in the vast majority of documented cases that something is a blocking high. In the mid-latitudes, high- and low-pressure systems normally travel from west to east, carrying heat away before it can build up. When an area of high pressure instead stops moving and stalls over a region for days, or in some cases weeks, cooler Atlantic or oceanic air can no longer get in: the heat stays put underneath, like under a lid nobody lifts.

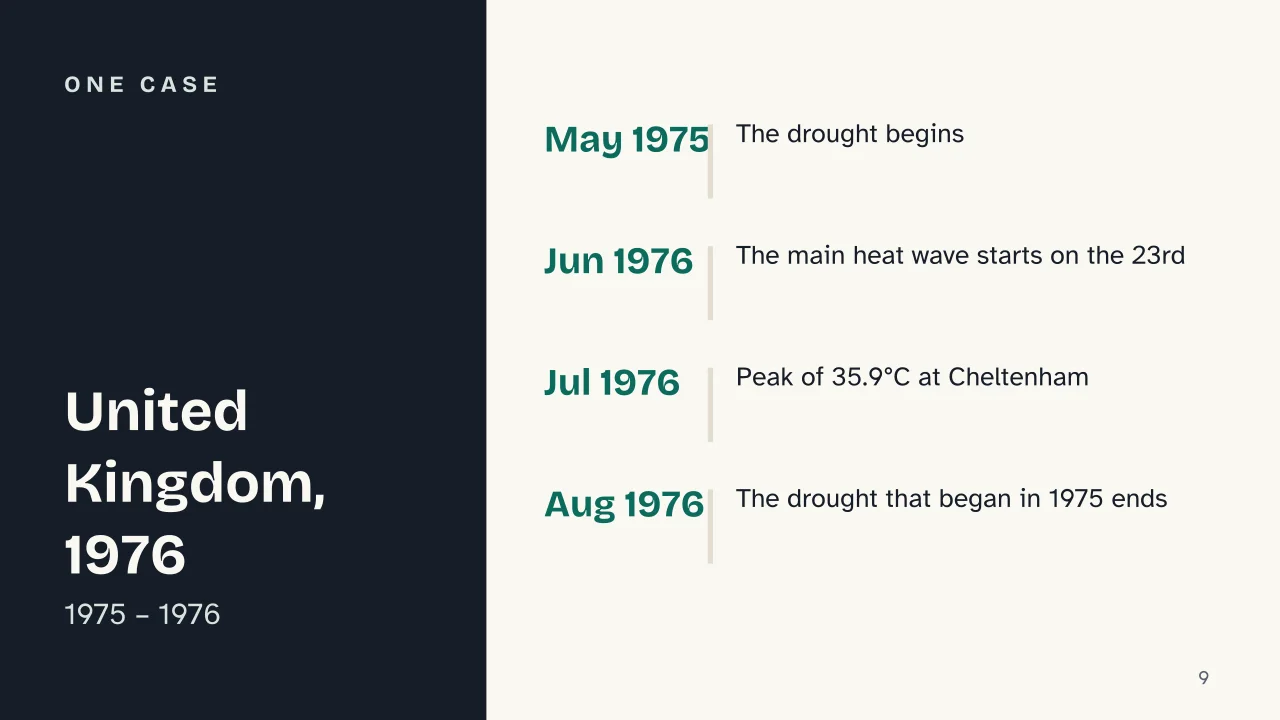
    Practical example: the British summer of 1976 formed exactly this way. A blocking high-pressure pattern stalled over the United Kingdom and trapped hot, dry air for weeks, keeping out the Atlantic weather systems that usually bring rain and relief. The main heat wave began on 23 June 1976, with temperatures consistently above 30°C across much of England, peaking at 35.9°C in Cheltenham on 3 July.

    Why sinking air warms up on its own

    Inside a blocking high a second, less intuitive process is also at work: air at the centre of the system tends to sink, a motion meteorologists call subsidence. As it descends, the air moves into a zone of higher pressure and compresses; compressing it warms up, much like the barrel of a bicycle pump heats up while you use it. This descending warm air also suppresses cloud formation, so the sky stays clear and the sun beats down unfiltered on the ground below.

    When this effect spreads across a wide enough area, meteorologists sometimes call it a “heat dome”: a dome-shaped region in which hot air is trapped near the surface by stable atmospheric conditions. That is what happened in June 2021 over the Pacific Northwest, spanning Canada and the United States, when an area of high pressure stalled and produced extreme temperatures that lasted about a week and beat local records — some up to 70 years old — by more than 6°C in several places.

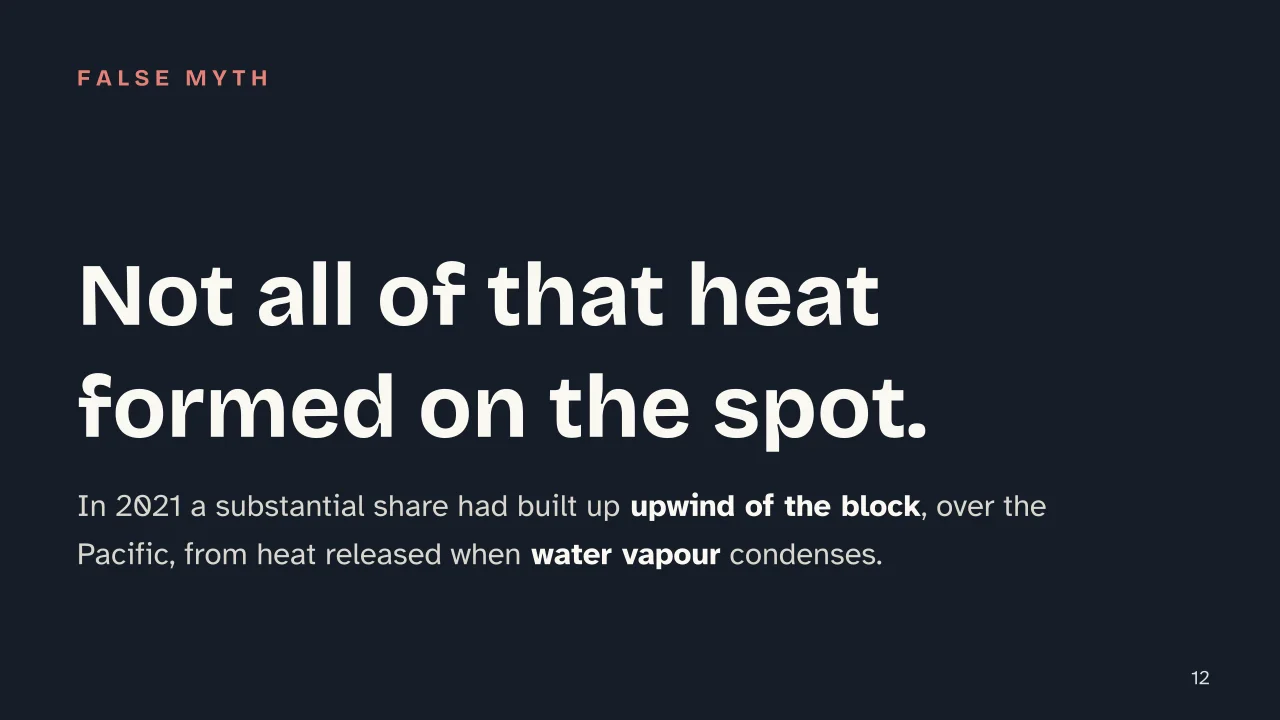
    One lesser-known detail of that event: not all of the anomalous heat had formed on the spot. A substantial share had built up upwind of the block, over the Pacific Ocean, through so-called latent heating — the heat released when water vapour condenses into clouds and weather systems — which was then carried inland along with the moving air mass. The mechanism behind the water cycle — evaporation and condensation — is not only about rain: it can also feed a heat wave hundreds of kilometres from where the vapour first formed.

    What adds fuel to the fire

    A blocking high and subsidence explain most of a heat wave on their own, but they rarely act alone. Among the factors that can amplify its intensity:

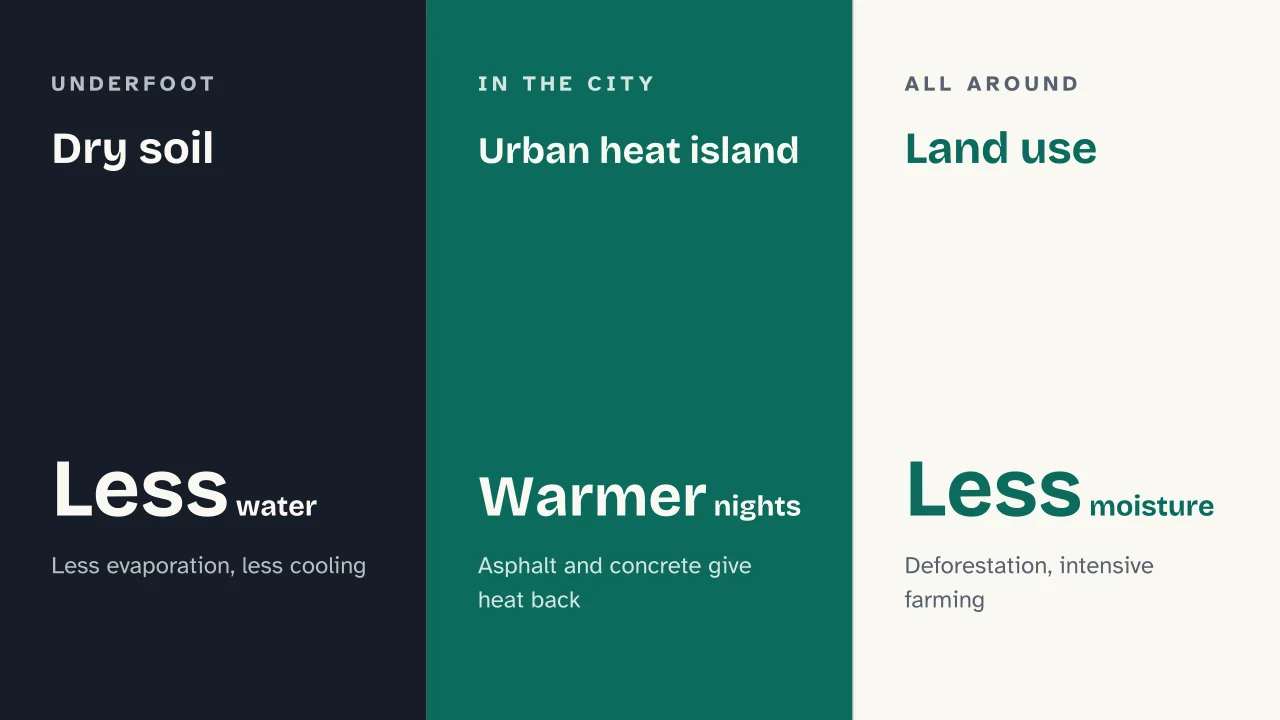
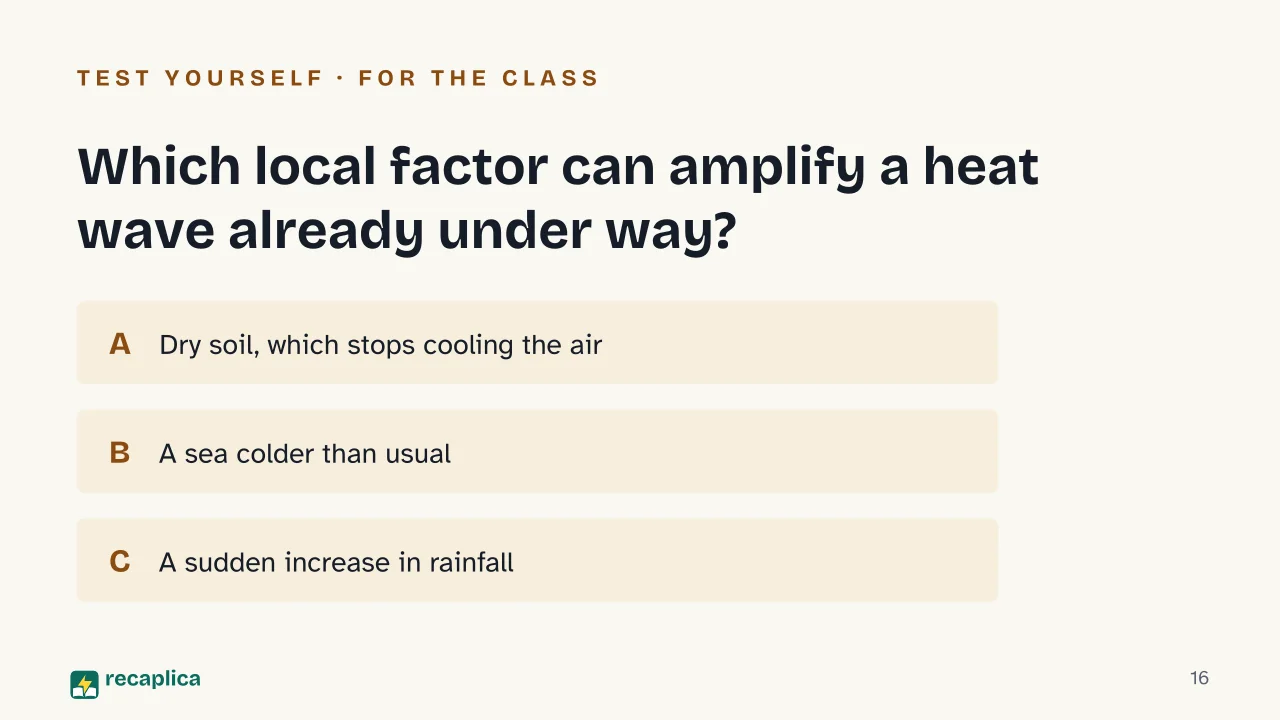
    • Dry soil. If drought precedes the arrival of the block, the ground already has little water left to give back to the air through evaporation: less evaporation means less natural cooling, so more heat builds up at the surface, which in turn dries the soil out further. It is a feedback loop that keeps feeding itself until the atmospheric pattern changes.
    • The urban heat island. Asphalt, concrete, and buildings absorb more solar energy during the day than vegetation or open land, and release it at night: cities therefore tend to stay warmer than the surrounding countryside, even under the same heat wave.
    • Land-use changes. Deforestation and intensive agriculture can alter the surface energy balance and moisture, adding to the effects of the blocking high.

    Practical example: in the United Kingdom in 1976, the soil-atmosphere feedback played a direct role. The drought that preceded the heat wave had begun in May 1975 and continued until August 1976: by the time the blocking high arrived, the soil was already depleted of water, which helped intensify the heat. Documented impacts included water restrictions, failed harvests, and wildfires.

    Two heat waves compared

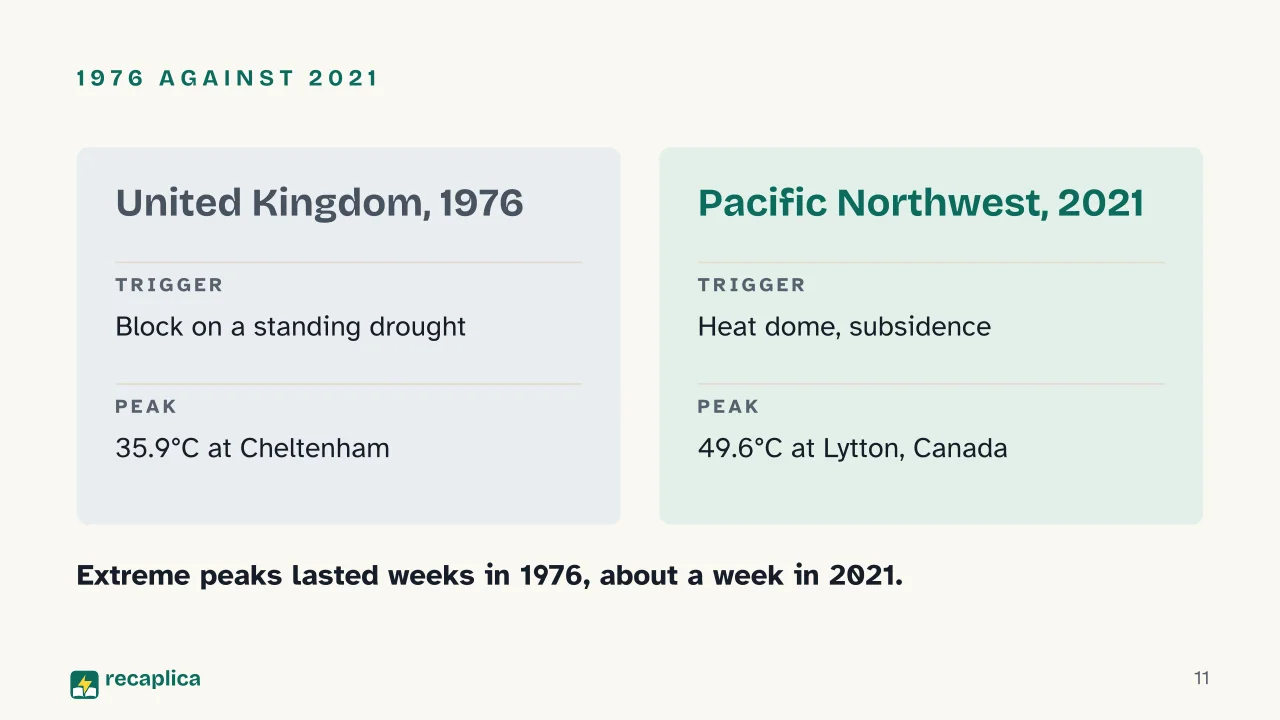
    The mechanisms behind the British summer of 1976 and the North American heat dome of 2021 look similar at their core, but the numbers tell very different stories:

    United Kingdom, 1976Pacific Northwest, 2021
    TriggerBlocking high on top of pre-existing droughtHeat dome, subsidence
    Peak temperature35.9°C (Cheltenham, 3 July)49.6°C (Lytton, Canada)
    Duration of extreme peaksWeeksAbout a week
    Margin over previous recordUK’s hottest summer on average+4.6°C over the Canadian national record

    The UK’s all-time temperature record, it should be said, does not belong to 1976: it was only broken in 2022, with 40.3°C measured at Coningsby. These are two different milestones — the hottest summer on average and the single highest temperature ever recorded — that often get mixed up.

    Where a changing climate fits in

    A high-pressure system can stall independently of global warming: it is an atmospheric phenomenon observed for decades, as the 1976 case shows. One of the factors climate change appears to add, according to Copernicus’s analysis, is a higher starting baseline for temperatures: if the average climate is already warmer, the same atmospheric patterns as always more easily produce extreme values, with heat waves that are more frequent, more intense, and longer.

    For the 2021 event, studies gathered by Carbon Brief estimated that human-caused warming contributed around 1°C to the extreme temperatures recorded, by raising average summertime starting temperatures. The rest of the anomaly, and its statistical rarity — estimated at somewhere between 1 event every 200 years and 1 every 100,000, depending on the method — comes down to the local atmospheric mechanisms described above: blocking, subsidence, and heat carried in from upwind. It is a contribution that adds to that of the greenhouse effect, the underlying mechanism raising the planet’s average temperatures.

    The public health impact of these events is far from negligible: the British Columbia Coroners Service attributed 619 deaths in the province to the 2021 heat wave, with a broader preliminary estimate putting the regional toll at least at 868 deaths; the heat wave also likely killed more than a million mussels along a single 100-metre stretch of coastline. In Europe, Copernicus estimates 61,700 heat-related deaths in 2022, 47,700 in 2023, and 62,800 in 2024, with heat-related deaths rising in 94% of monitored regions between 2000 and 2020.

    Slide deck

    Slides ready to download and make your own in PowerPoint or Google Slides, with speaker notes. Pick the Flash cut or the Full one.

    Slide 1 of the presentation on Heat Waves: Heat WavesSlide 2 of the presentation on Heat Waves: How many degrees make a heat wave?Slide 3 of the presentation on Heat Waves: How we will get thereSlide 4 of the presentation on Heat Waves: Chapter 01: A lid that never liftsSlide 5 of the presentation on Heat Waves: How a heat wave formsSlide 6 of the presentation on Heat Waves: Why does sinking air warm up on its own?Slide 7 of the presentation on Heat Waves: Chapter 02: What adds fuel to the fireSlide 8 of the presentation on Heat Waves: Dry soil · Urban heat island · Land useSlide 9 of the presentation on Heat Waves: One caseSlide 10 of the presentation on Heat Waves: Chapter 03: Two heat waves comparedSlide 11 of the presentation on Heat Waves: 1976 against 2021Slide 12 of the presentation on Heat Waves: Not all of that heat formed on the spot.Slide 13 of the presentation on Heat Waves: Chapter 04: Where a changing climate fits inSlide 14 of the presentation on Heat Waves: What global warming addsSlide 15 of the presentation on Heat Waves: The public health impactSlide 16 of the presentation on Heat Waves: Which local factor can amplify a heat wave already under way?Slide 17 of the presentation on Heat Waves: And now, the review
    Flash10 slidesThe essential thread, to present in classFull17 slidesEvery chapter and the deeper detail

    Common myths

    • ✗ Myth A heat wave is just a somewhat hotter summer, no different from the heat every year brings.

      ✓ Reality In fact it has a recognisable physical mechanism — almost always a blocking high that stalls for days or weeks — and severity thresholds that each region sets against its own usual climate: the same temperature can be unremarkable in one place and an all-time record elsewhere, as with the UK record at Coningsby in 2022.

    • ✗ Myth The heat behind a heat wave always forms on the spot, in the area it later hits.

      ✓ Reality Not always: in the 2021 Pacific Northwest heat dome, a substantial share of the anomalous heat formed upwind of the block, over the ocean, through heat released by condensing water vapour, before moving inland.

    • ✗ Myth Climate change alone explains the full intensity of every heat wave.

      ✓ Reality Studies cited by Carbon Brief on the 2021 event attribute roughly 1°C of the extreme temperatures recorded to human-caused warming: the rest of the anomaly comes down to local atmospheric mechanisms (blocking, subsidence, soil-atmosphere feedback). Estimates of how statistically rare the event would be without human-driven warming vary widely, from 1 in 200 years to 1 in 100,000, depending on the method used.

    Mind map

    Drag the background to move around and the nodes to reposition them; use − and + to collapse and expand branches.
    Customize
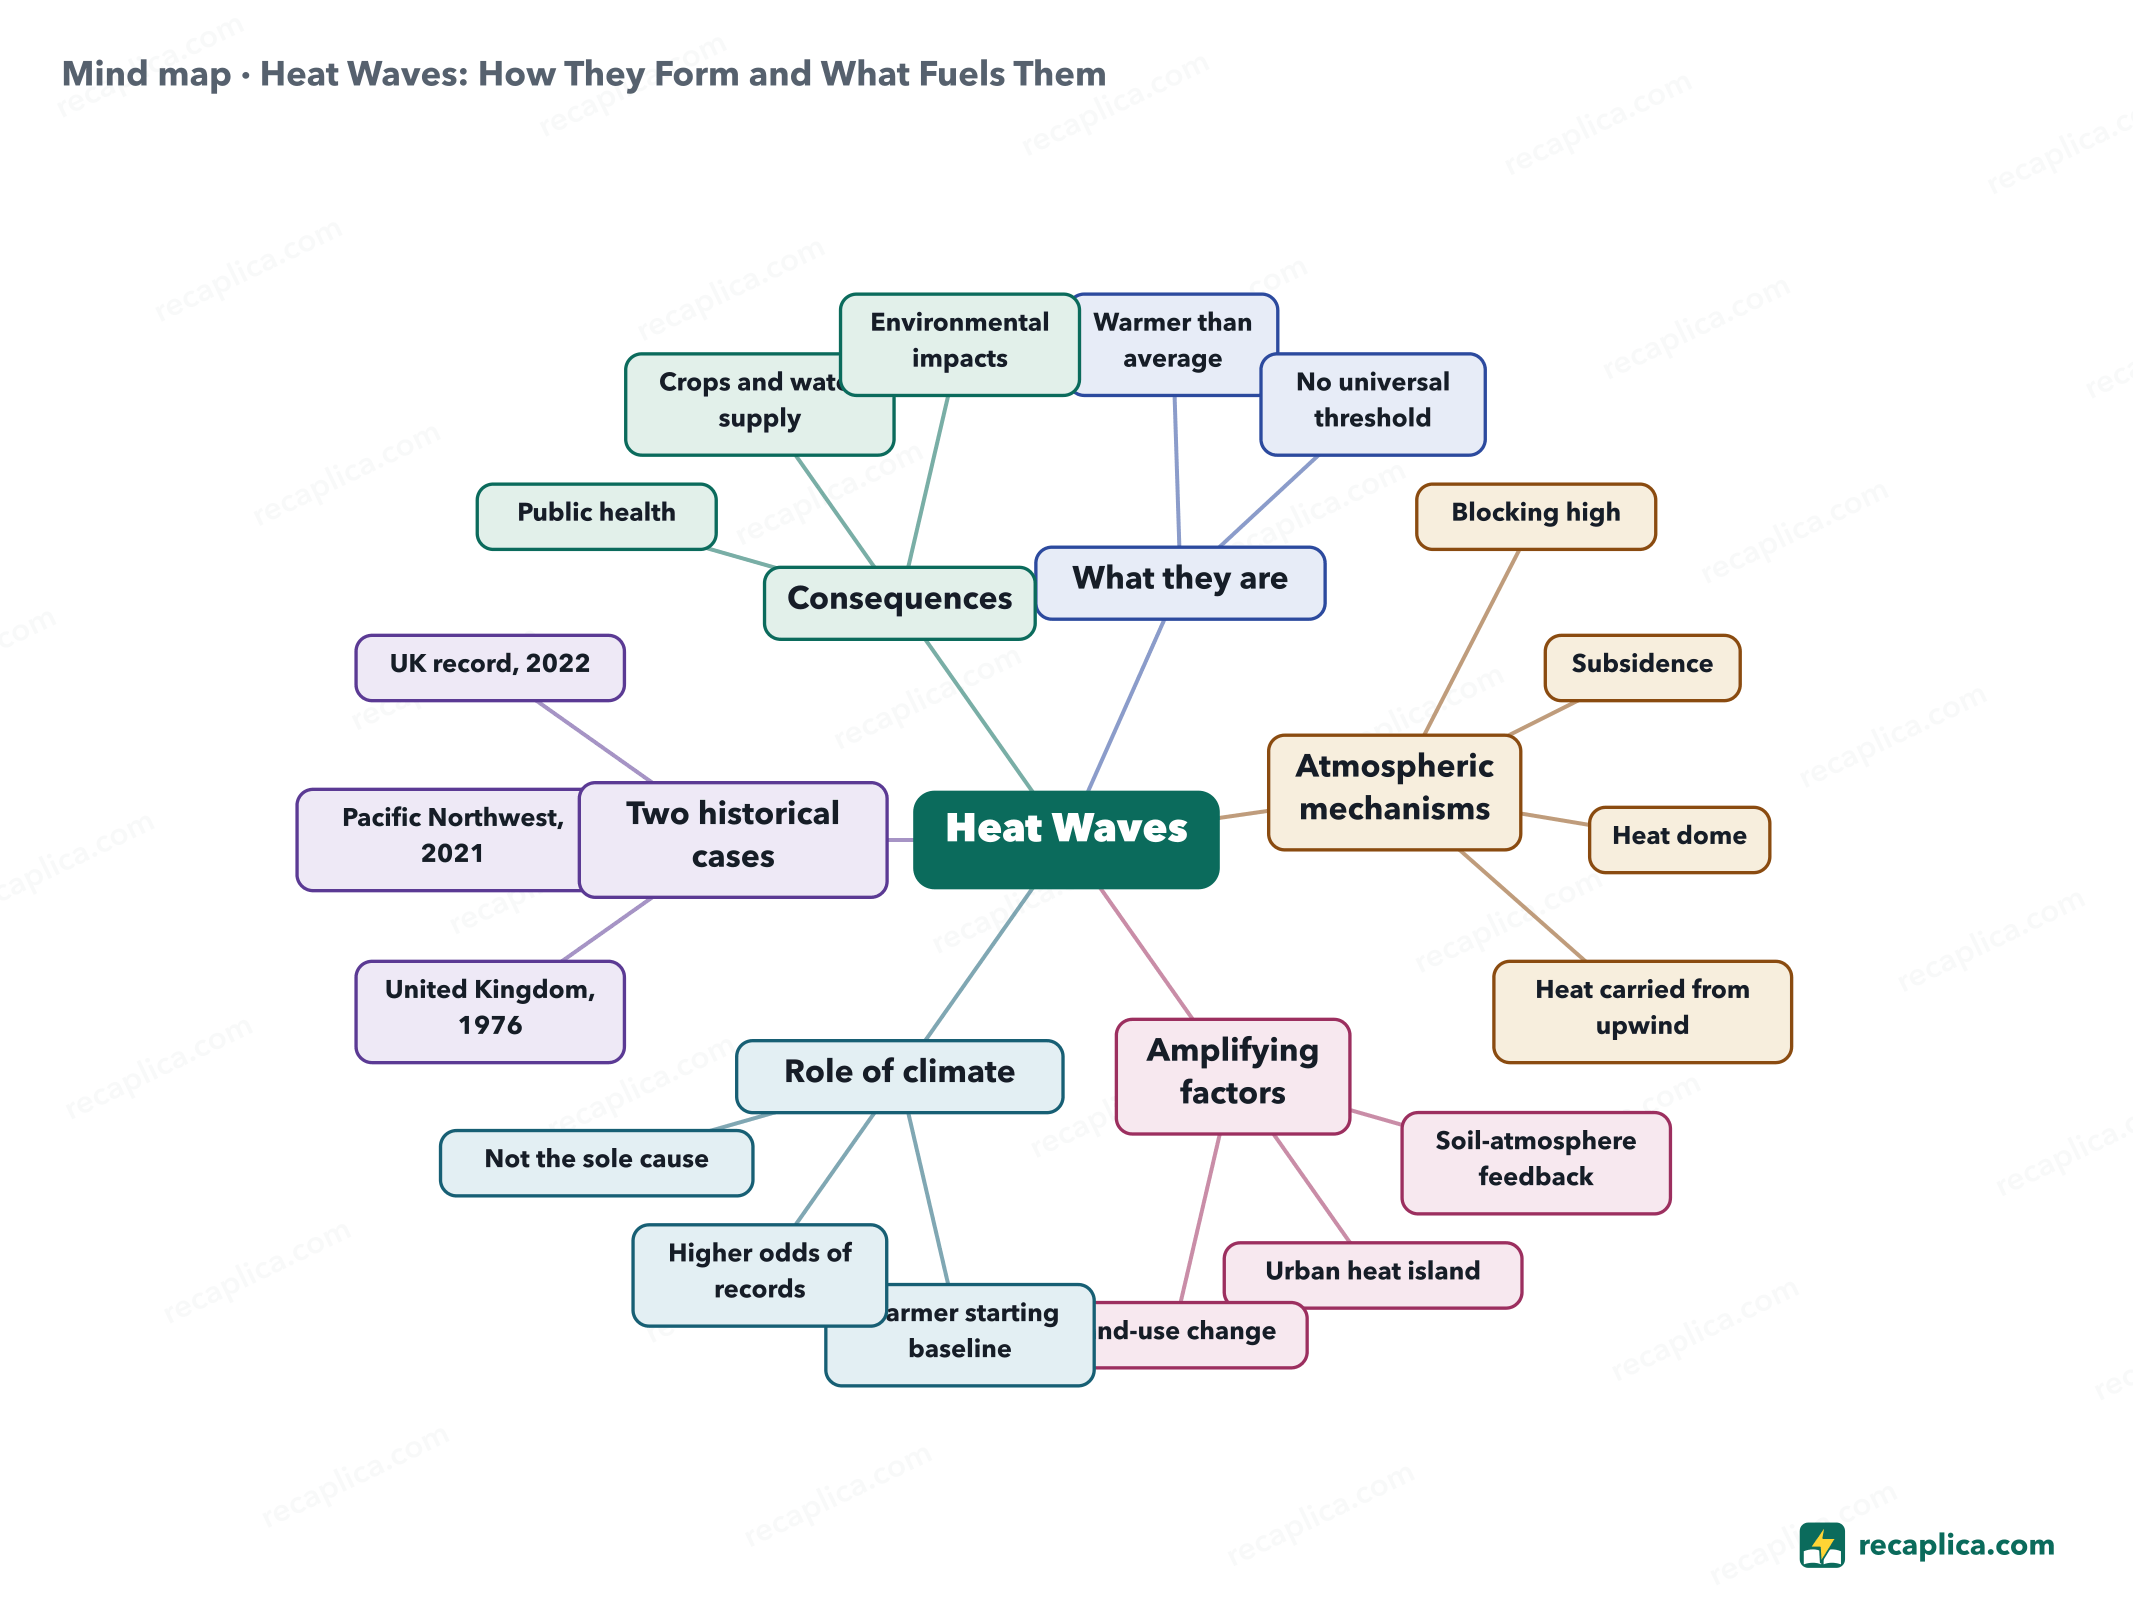
    Mind map: Heat Waves: How They Form and What Fuels Them
    • Heat Waves
      • What they are
        • Warmer than average Compared to the usual climate of a place and season
        • No universal threshold
      • Atmospheric mechanisms
        • Blocking high High pressure stalled for days or weeks
        • Subsidence Air sinks, compresses, warms
        • Heat dome Hot air trapped near the ground
        • Heat carried from upwind Latent heating from water vapour condensing
      • Amplifying factors
        • Soil-atmosphere feedback Dry soil, less evaporation, more heat
        • Urban heat island
        • Land-use change Deforestation, agriculture
      • Role of climate
        • Warmer starting baseline
        • Higher odds of records
        • Not the sole cause
      • Two historical cases
        • United Kingdom, 1976 Blocking high, drought since 1975
        • Pacific Northwest, 2021 Heat dome, record at Lytton
        • UK record, 2022 40.3°C at Coningsby
      • Consequences
        • Public health Deaths estimated between 2022 and 2024 in Europe
        • Crops and water supply
        • Environmental impacts Wildlife and wildfires

    Quiz: test yourself

    Answer the questions to check what you have learned: you get instant feedback and a short explanation.

    Grade 0/10 0/5
    1 How does Copernicus define a heat wave?

    There is no universal definition: every region of the world uses different thresholds based on its own climate, geography, and local social context.

    2 What is the most frequent mechanism that triggers a heat wave?

    Heat waves are often linked to persistent high-pressure systems, which suppress cloud formation and reduce rainfall for days or weeks.

    3 What happens to the air sinking at the centre of a blocking high?

    This is subsidence: air descending from higher levels compresses and warms through adiabatic compression, creating stable conditions that trap heat near the ground.

    4 True or false: in 2021 the Canadian temperature record was broken by a few tenths of a degree.

    False: Lytton reached 49.6°C, a full 4.6°C above the previous national record of 45°C set in Saskatchewan in 1937 — an enormous margin for a temperature record.

    5 Which local factor can amplify a heat wave already under way?

    This is the soil-atmosphere feedback: soil that is already dry evaporates less water, the air heats up more, and this dries the soil out further. Cities add the urban heat island on top of that.

    Answers: 1-A · 2-A · 3-A · 4-B · 5-A

    Flashcards

    Tap the card to flip it and check whether you remember the answer, then move to the next one.

    1 / 7

    Explain it in your own words

    The ultimate test: if you can explain it in simple words, you've truly understood it. Write your explanation, then compare it with the Recap.

    Your explanation is saved only on this device.

    A heat wave is a period of weather that is warmer than average for a given place and time of year: there is no single temperature threshold that applies everywhere. The most common mechanism is a high-pressure system that stalls over a region for days or weeks, blocking cooler air from moving in; the air sinking inside it compresses and warms, an effect behind the so-called "heat domes". Local factors such as dry soil and cities, which hold onto more heat than open countryside, can add to the effect. Global warming does not create a heat wave on its own, but it raises the starting temperature and makes extreme values more likely.

    Frequently asked questions

    How long can a heat wave last?

    There is no fixed duration: it depends on how long the high-pressure system feeding it stays in place. The extreme temperatures of the 2021 North American heat dome lasted about a week, while the blocking high behind the 1976 British summer persisted for weeks, building on a drought that had begun in May 1975.

    What exactly is a "heat dome"?

    It is the name given to a dome-shaped area of high pressure in which hot air stays trapped near the ground: at the centre of the block, air descends from higher levels, compresses, warms up, and prevents the clouds from forming that might otherwise ease the heat.

    Does climate change cause heat waves?

    It does not generate the blocking highs that trigger them on its own, but it raises the average starting temperature: according to Copernicus this increases the likelihood of reaching extreme values and extends how often and how long heat waves last. For the 2021 event, studies cited by Carbon Brief attributed roughly 1°C of the extreme temperatures recorded to human-caused warming.

    Why do cities suffer more during a heat wave?

    Because of the urban heat island: asphalt, concrete, and buildings absorb more daytime heat than vegetation or open land and release it at night. Changes in land use, such as deforestation and intensive agriculture, also alter the surface energy balance and moisture.

    How many people died from heat in Europe between 2022 and 2024?

    According to data collected by Copernicus, Europe recorded an estimated 61,700 heat-related deaths in 2022, 47,700 in 2023, and 62,800 in 2024; between 2000 and 2020, heat-related deaths increased in 94% of the European regions monitored.

    Sources

    • Copernicus Climate Change Service — Heatwaves, a brief introduction
    • Met Office — 50 years since the summer of 1976
    • Carbon Brief — Guest post: the causes and impacts of the Pacific north-west's 2021 heatwave

    Every Recap goes through an independent review before publication.

    Every evening, the day's new Recaps on our Telegram channel. Join the channel →

    Keep learning

    • Science Weather Forecasting: How It Works, From Data to Models to Forecasters A weather forecast starts with thousands of measurements collected every day by ground stations, radar, satellites and radiosondes carried aloft by balloons. A numerical model takes that data as a starting snapshot and uses the equations of physics to calculate how the atmosphere will change hour by hour. The further out the forecast reaches, the more a tiny error in the starting data grows, which is why detailed forecasts hold up for roughly a week, while beyond 15 days large models such as the ECMWF's work only in probabilities. In the end it's still a forecaster who settles on what to communicate to the public, uncertainty included. Read the Recap →
    • Science How Thunderstorms Form: From Warm Air to Lightning A thunderstorm forms when warm, moist air near the ground gets pushed upward, meets unstable air, and keeps rising until it builds a towering cloud, the cumulonimbus. It goes through three stages: developing, then mature, and finally dissipating. A single storm cell typically lasts 30 to 60 minutes, while the whole process takes about an hour. The mature stage is also the most dangerous: updrafts and downdrafts coexist and bring heavy rain, hail, strong wind, and lightning; if the updraft starts rotating because of winds that shift with height, a supercell forms, the longest-lived storm type, and the one most associated with the most violent tornadoes. Some storms, instead of fading away, keep regenerating over the same spot for hours, dumping persistent rain. Read the Recap →
    • Science How Tornadoes Form: From Thunderstorm to Funnel A tornado is a violently rotating column of air that touches both the ground and the cloud it hangs from at the same time. The most violent and destructive tornadoes almost always form inside a supercell, a thunderstorm that rotates internally thanks to a circulation called a mesocyclone. The usual ingredients are moisture, atmospheric instability, a lifting mechanism and wind shear, meaning a change in wind direction and speed with height: together they generally raise the odds of a vortex forming, but they never guarantee one. The funnel does not descend from the cloud like a stretching limb; it forms near the ground and builds upward, and even after decades of research scientists still don't have a complete picture of exactly what turns a mesocyclone into a tornado. Read the Recap →

    recaplica

    Clear in 30 seconds, yours in 10 minutes.

    Recaps Mind maps Request a Recap Telegram channel Mind map maker Our method About Privacy & cookies Legal notes & terms of use

    © 2026 Recaplica · A project by Curi S.r.l. — VAT IT05472000750

    Statistics, only if you say so

    To learn which Recaps help most we would use Google Analytics, with aggregate, anonymous data. It starts only with your OK, and you can change your mind anytime. Privacy policy